Object Detection and Segmentation
EE 641 - Unit 2
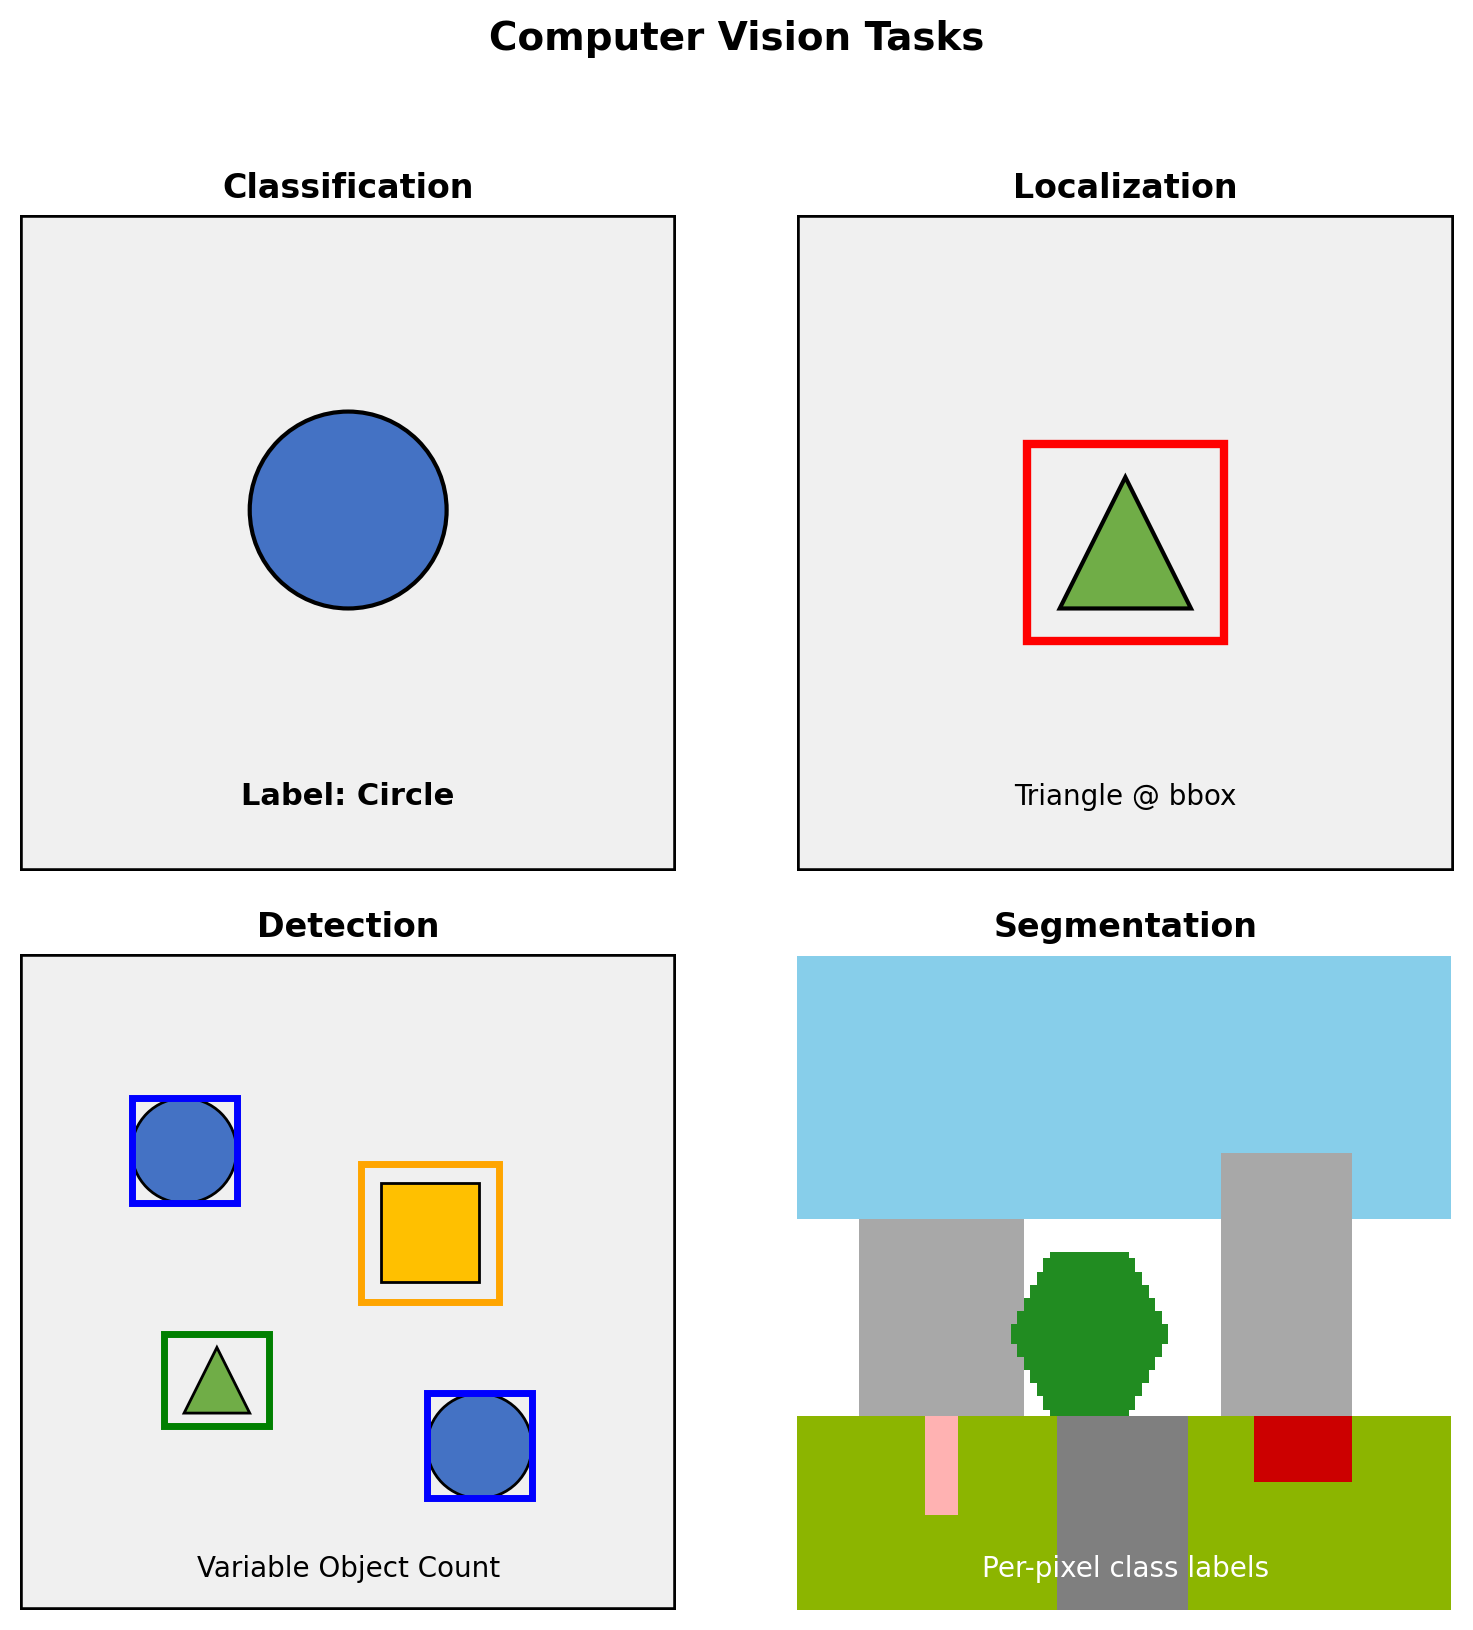
The Scene Sets the Number of Detections
\[\mathcal{Y} = \bigcup_{n=0}^{N} \left(\{1, ..., C\} \times \mathbb{R}^4\right)^n\]
Output
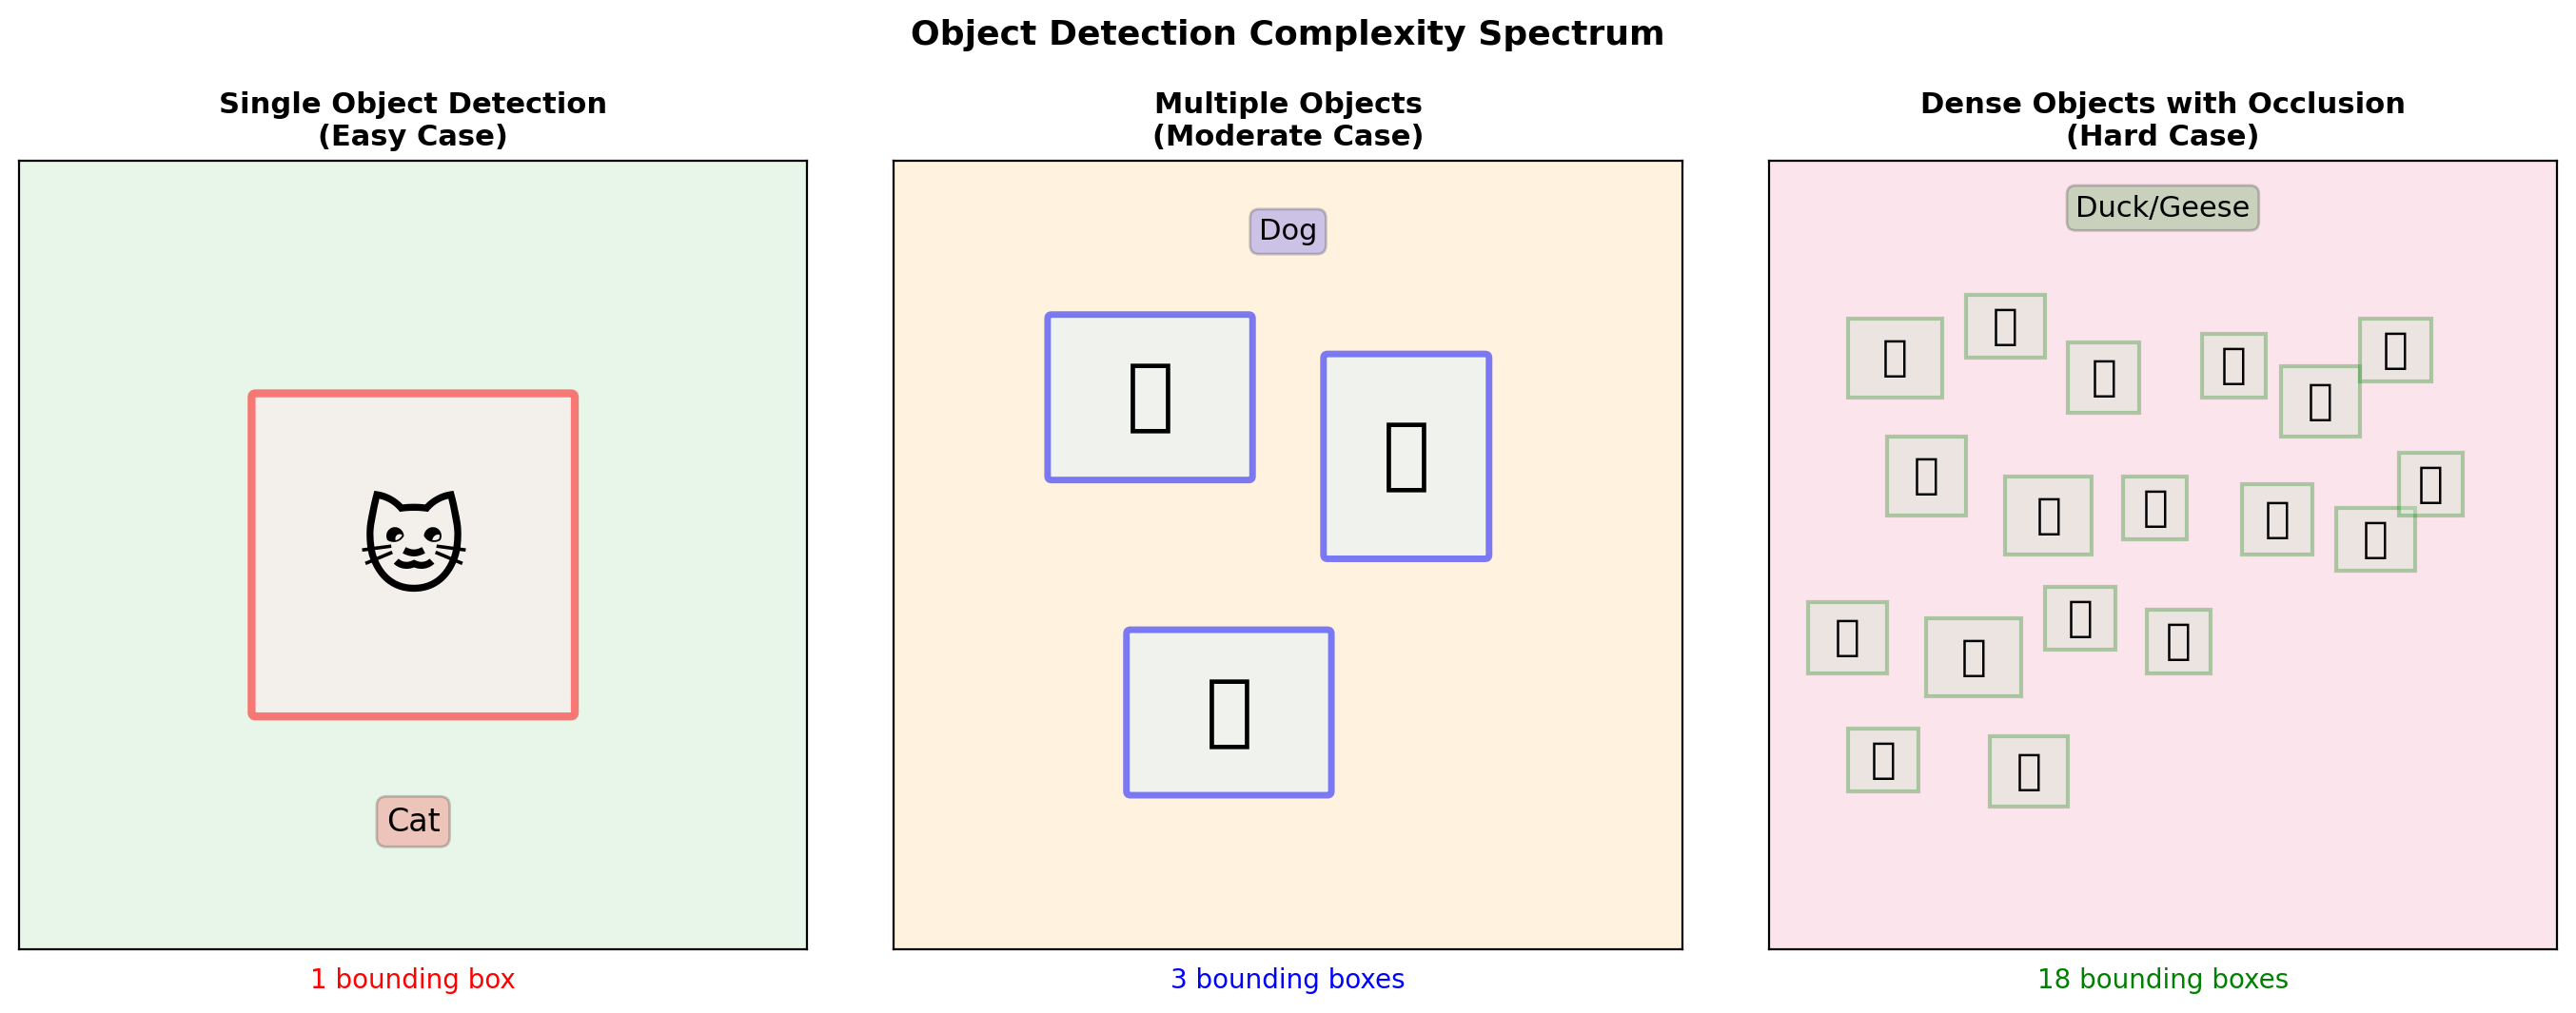
- \(n\) varies with the scene - zero on an empty road, dozens in a crowd
- Unordered - no correspondence between output position and object
Network
- A head has fixed width, set at design time
- Independent outputs can duplicate the same object
A fixed-width head cannot emit a scene-sized set directly.
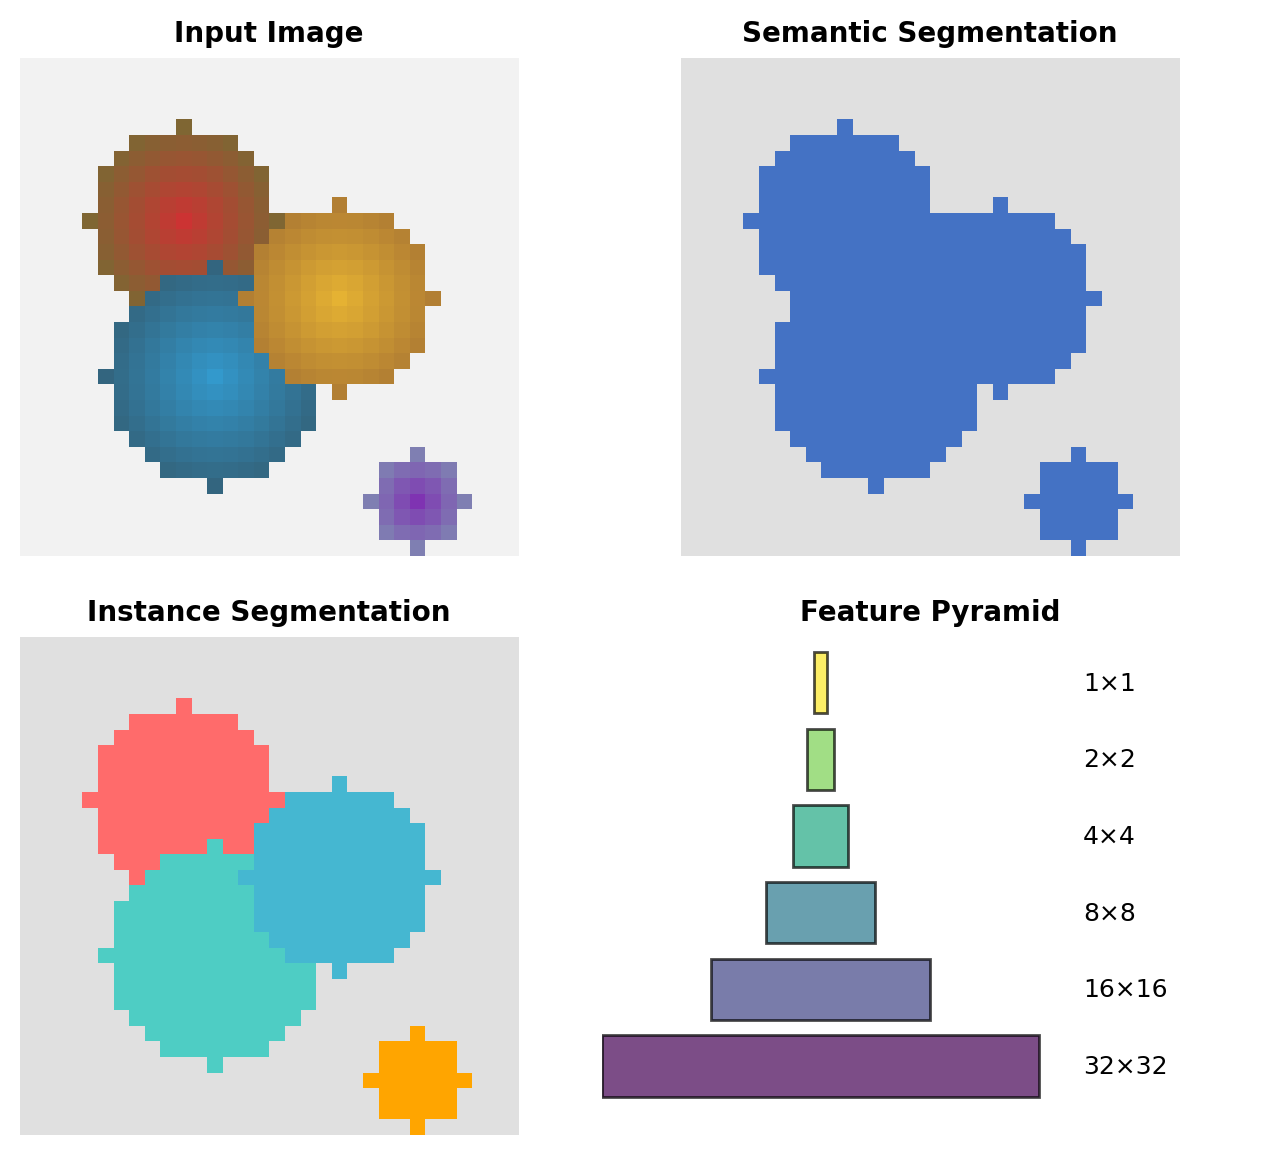
Instance Labels Separate Touching Objects
Segmentation returns to a fixed-shape output - at every pixel:
Semantic - a class per pixel
- \(y[i,j] \in \{1, ..., C\}\)
- Touching objects of one class merge into a single region
Instance - an identity per pixel
- \(y[i,j] \in \{0, 1, ..., N\}\), with \(N\) set by the scene - the cardinality problem again
- The boundary between touching objects is resolved pixel by pixel
Features are 32× coarser than the output
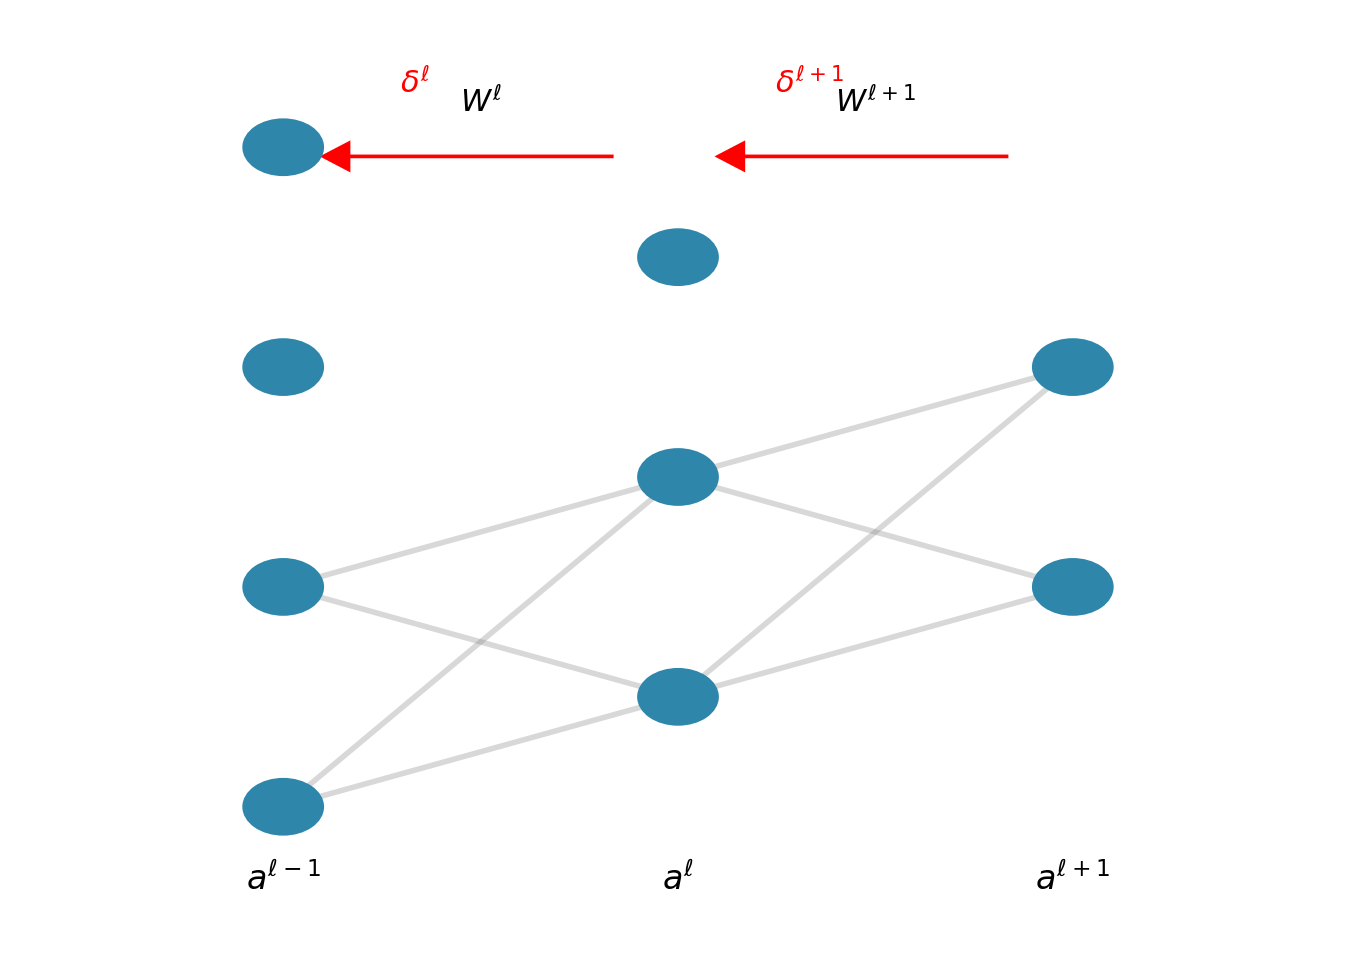
- Backbone: \(H/32 \times W/32\) after five downsamples
- Required: a label at every pixel of \(H \times W\)
Dense output from downsampled features is the central segmentation problem.
Detectors Score Candidates and Filter Duplicates
Candidate boxes
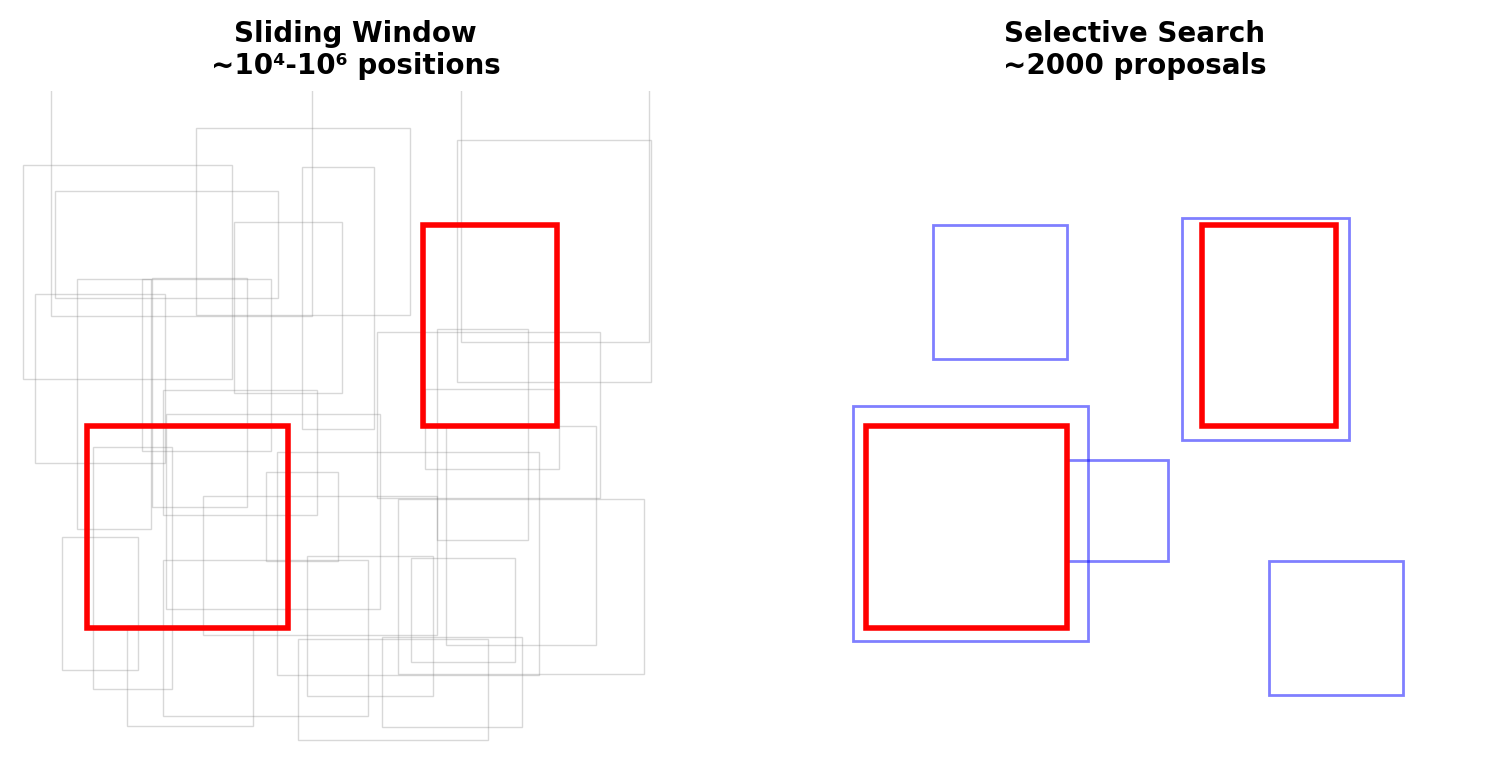
- A large fixed set of boxes, positioned before the image is seen
- Per-box classification and regression replace the set problem
- Confidence thresholds the boxes - duplicate removal keeps the highest-scoring one per object
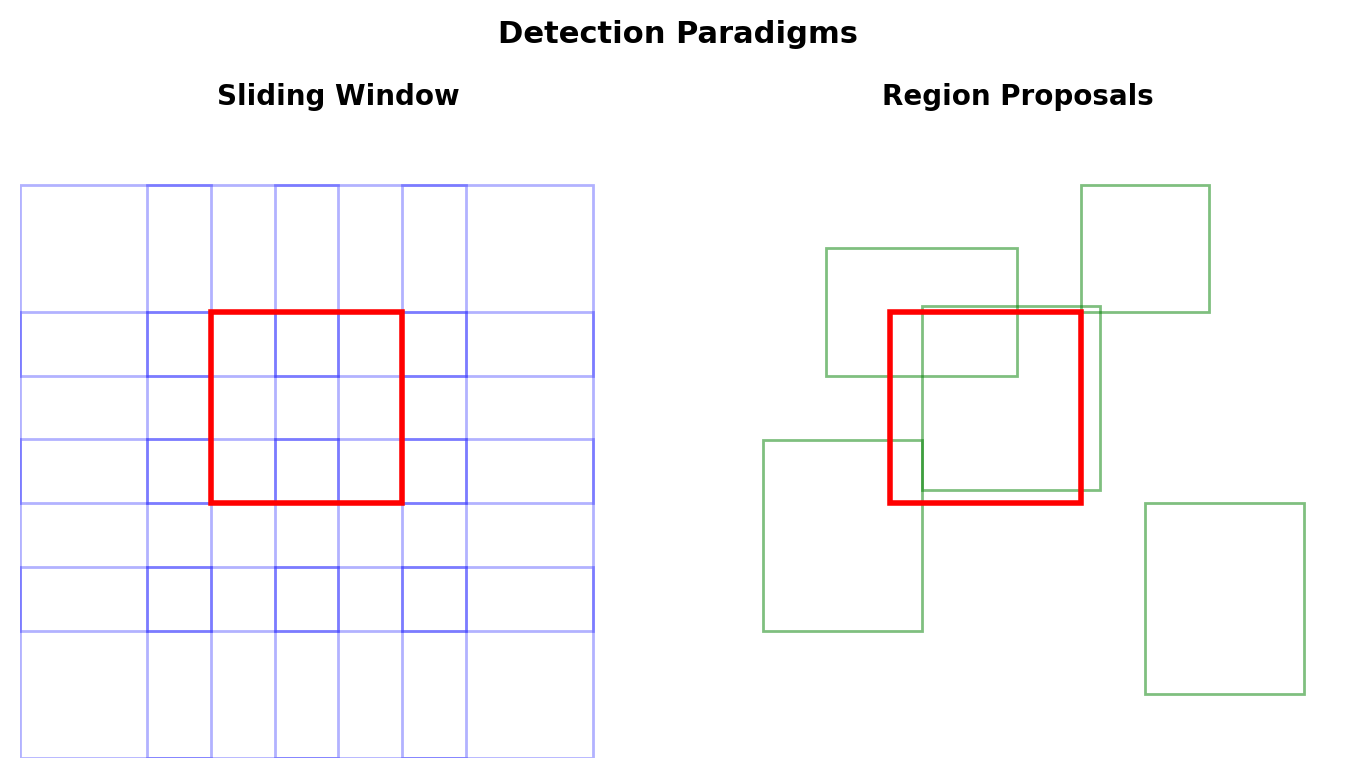
Two approaches supply the candidates:
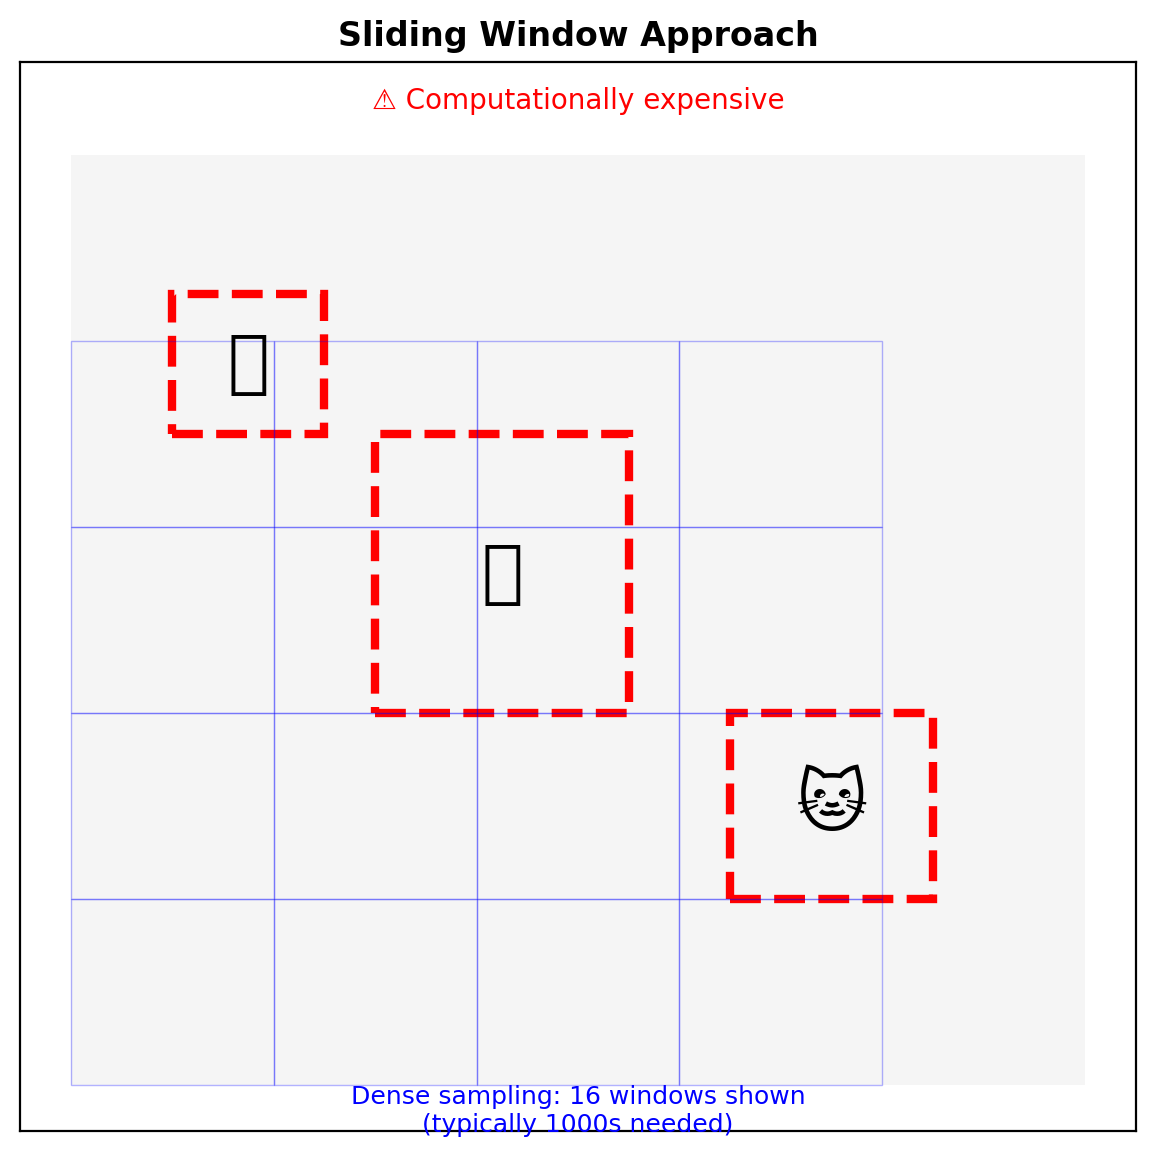
Dense - score every grid position (single-shot section)
- A classifier applied at every position is a convolution - one pass scores all \(H/s \times W/s\) window positions at stride \(s\)
- 10⁴-10⁵ candidates per image, nearly all background: YOLO, SSD, RetinaNet
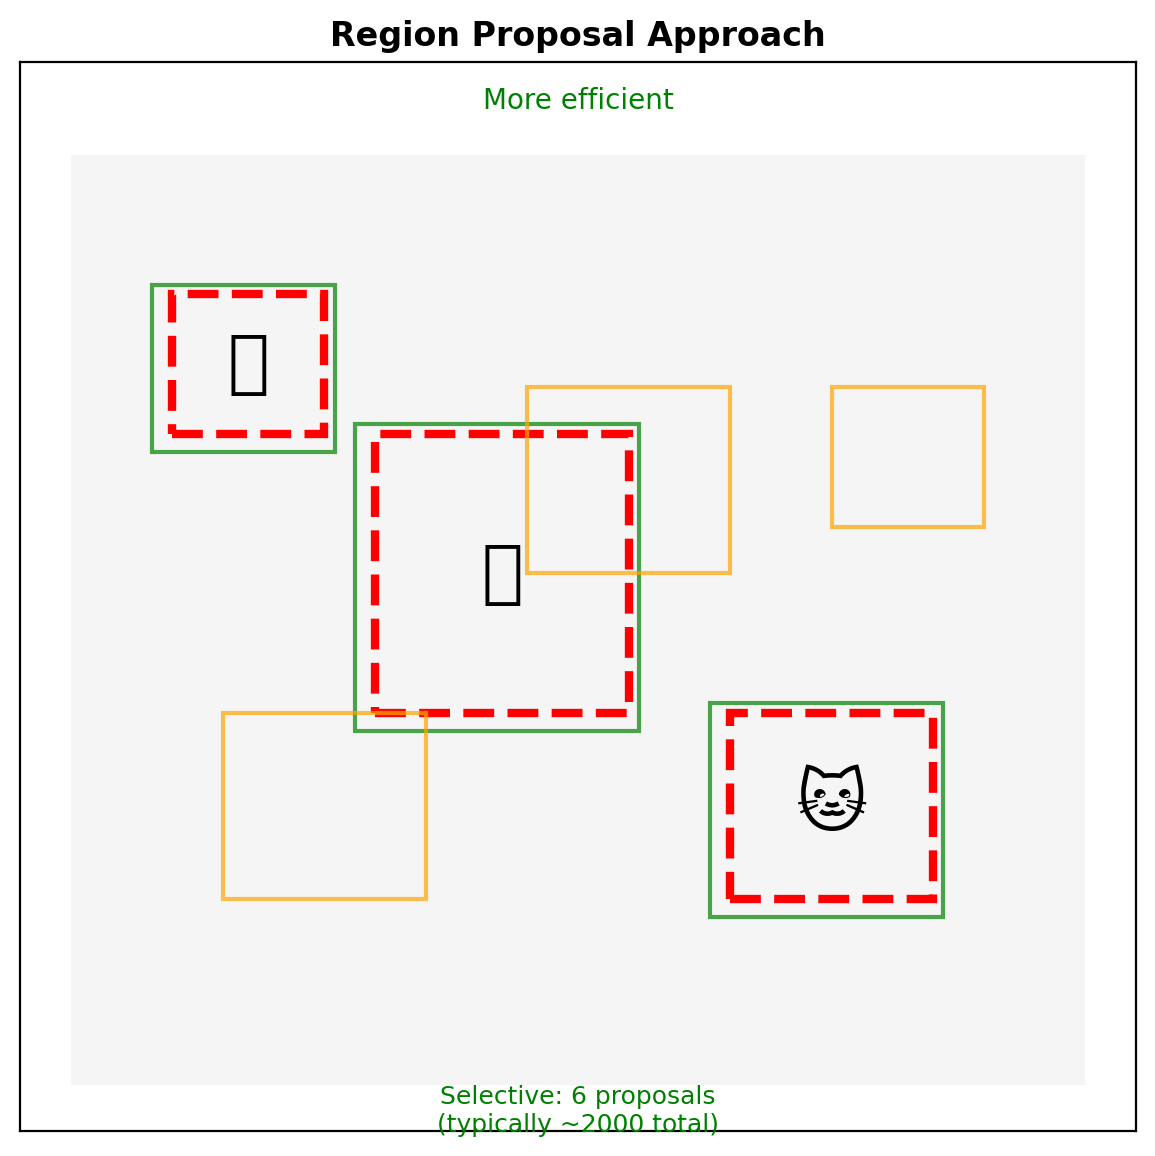
Proposed - score a selected subset (region-based section)
- A first stage selects ~10³ regions likely to contain objects, a second classifies each: the R-CNN family
- Fewer candidates, more computation per candidate
Candidate count against per-candidate computation separates the two approaches.
Stride and Receptive Field Bound Detectable Sizes
Candidates must span every object size the scene contains.
Object scale is unbounded
- Classification benchmarks crop or resize to one object - detection receives the full scene
- A 20 px pedestrian and a 600 px bus share one frame, and both must be found
A feature map’s range is bounded
- Every candidate is scored from feature-map cells
- Stride \(s\) sets how densely the map samples - objects smaller than \(s\) fall between cells
- Receptive field \(r\) sets how much image each cell integrates - objects larger than \(r\) exceed what any cell computes from
- Depth trades one bound for the other - deep maps integrate widely but sample coarsely, early maps the reverse
Feature pyramids, multi-scale heads, and dilated convolutions are responses to these bounds.
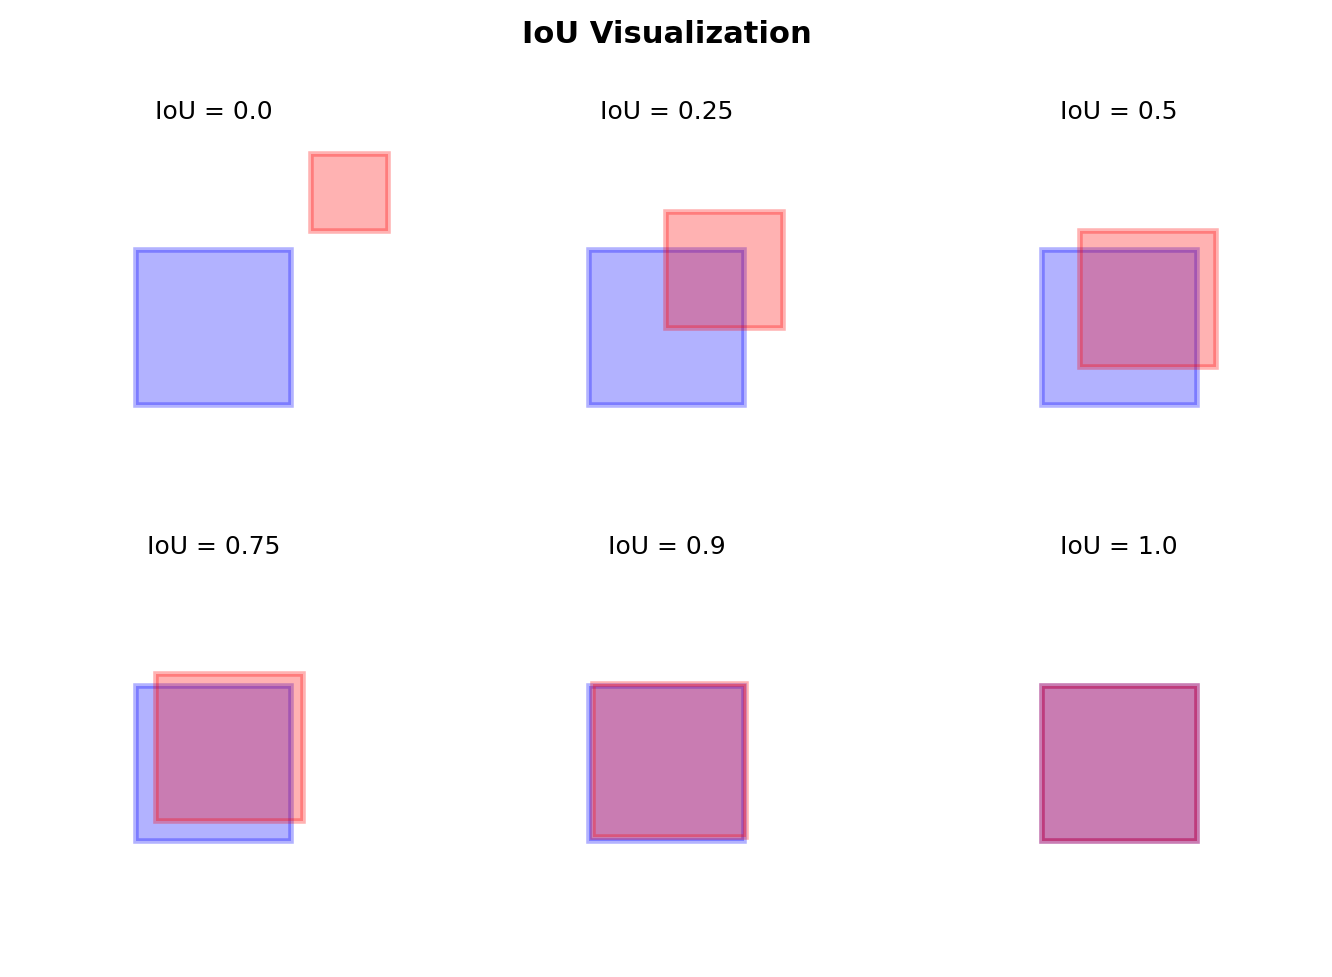
IoU Measures Overlap Independent of Scale
Training and evaluation both need one measure - how well one box matches another. Intersection over union measures it by area:
\[\text{IoU}(B_1, B_2) = \frac{|B_1 \cap B_2|}{|B_1 \cup B_2|}\]
Properties
- Range \([0, 1]\) - 1 only if identical, 0 only if disjoint
- Scale-invariant: \(\text{IoU}(\alpha B, \alpha B') = \text{IoU}(B, B')\)
- Zero, with zero gradient, once boxes are disjoint - regression on IoU alone receives no update from a distant start
Uses
- Evaluation - a detection counts only above a threshold \(\tau\)
- Training - candidate labels (positive/negative) come from IoU against ground truth, with rules set per detector
- Duplicate removal - a detection overlapping a higher-scoring one is suppressed by IoU threshold
- Matching - each ground truth is matched to at most one prediction, in confidence order
Coordinate L2 Loss Favors Large Boxes
Parameterizations
- Corners \((x_{min}, y_{min}, x_{max}, y_{max})\) - annotation format
- Center + size \((x_c, y_c, w, h)\) - regression target
Scale dependence
\[\mathcal{L}_{L2} = \|b - \hat{b}\|_2^2\]
- 10 px miss: IoU 0.60 on a 40 px box, 0.97 on a 600 px box - same 100 px² loss
- Gradient follows pixels, not quality - large boxes dominate the signal
Fixes
- Offsets normalized by a reference box (introduced with anchors, region-based section)
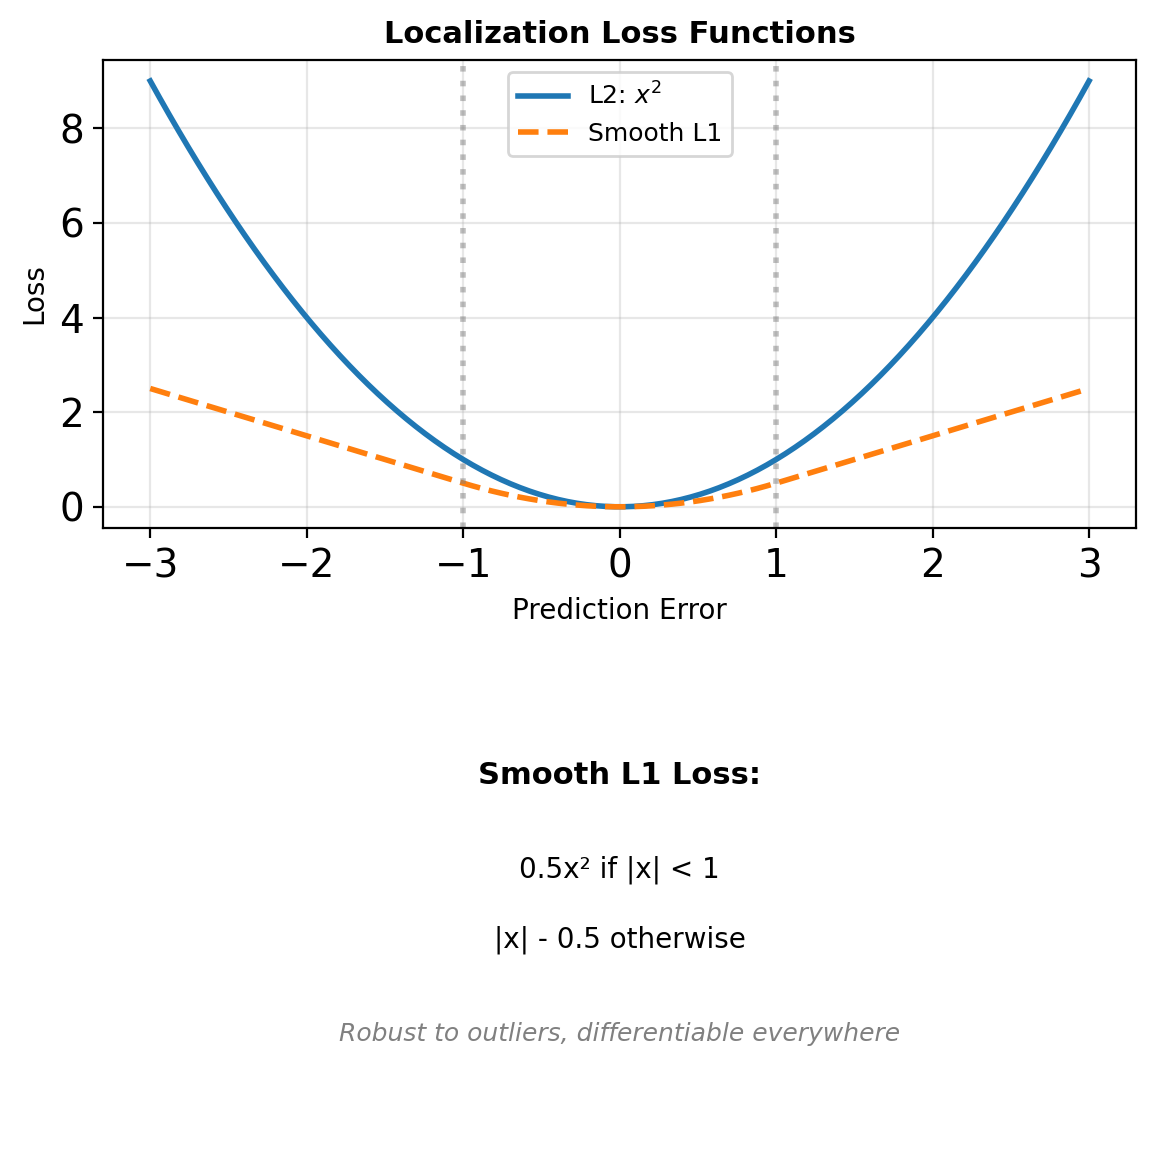
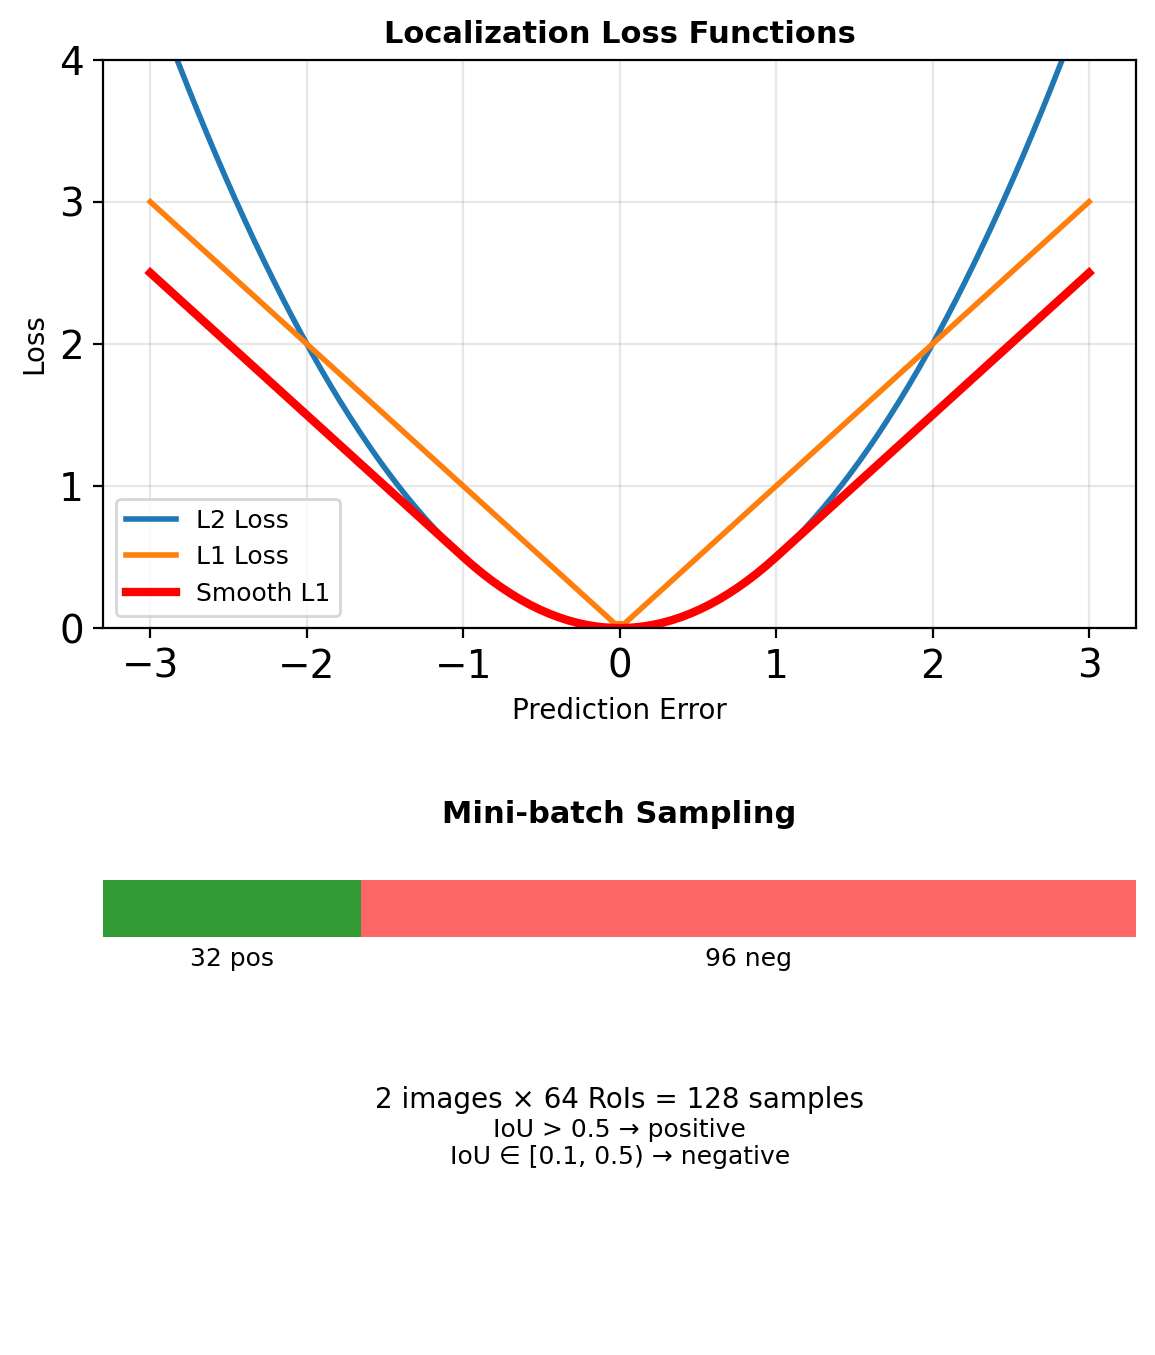
- Smooth L1 caps outlier gradients:
\[\text{smooth}_{L1}(x) = \begin{cases} 0.5\,x^2 & |x| < 1 \\ |x| - 0.5 & \text{otherwise} \end{cases}\]
Both appear again in the region-based and single-shot training losses.
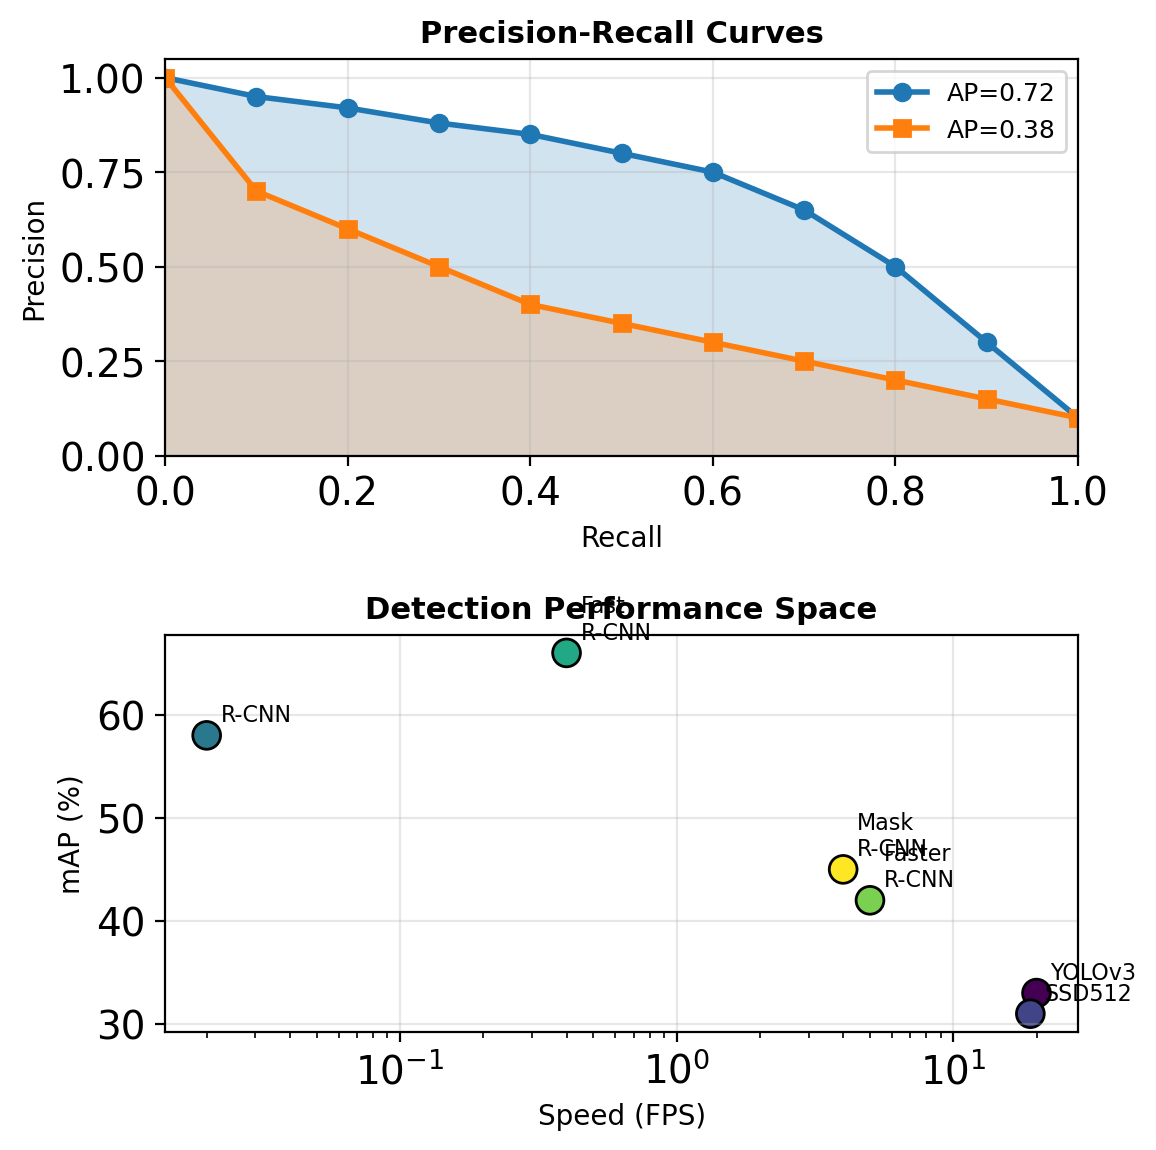
mAP Averages Precision over Recall and IoU
Mean average precision: the rank-based score of the full detection set.
Average precision, per class
- Rank detections by confidence
- \(\text{IoU} > \tau\) with a ground truth no higher-ranked detection has claimed: TP. Otherwise: FP
- Running counts trace the precision-recall curve
- AP = area under the curve. mAP = the mean over classes
Threshold sweep
- mAP@0.5 - a 0.51-IoU box counts the same as a perfect one
- mAP@[.5:.95] - the mean over 10 thresholds, so each 0.05 of overlap raises the score (COCO)
A single reported mAP combines every class, threshold, and ranking into one number.
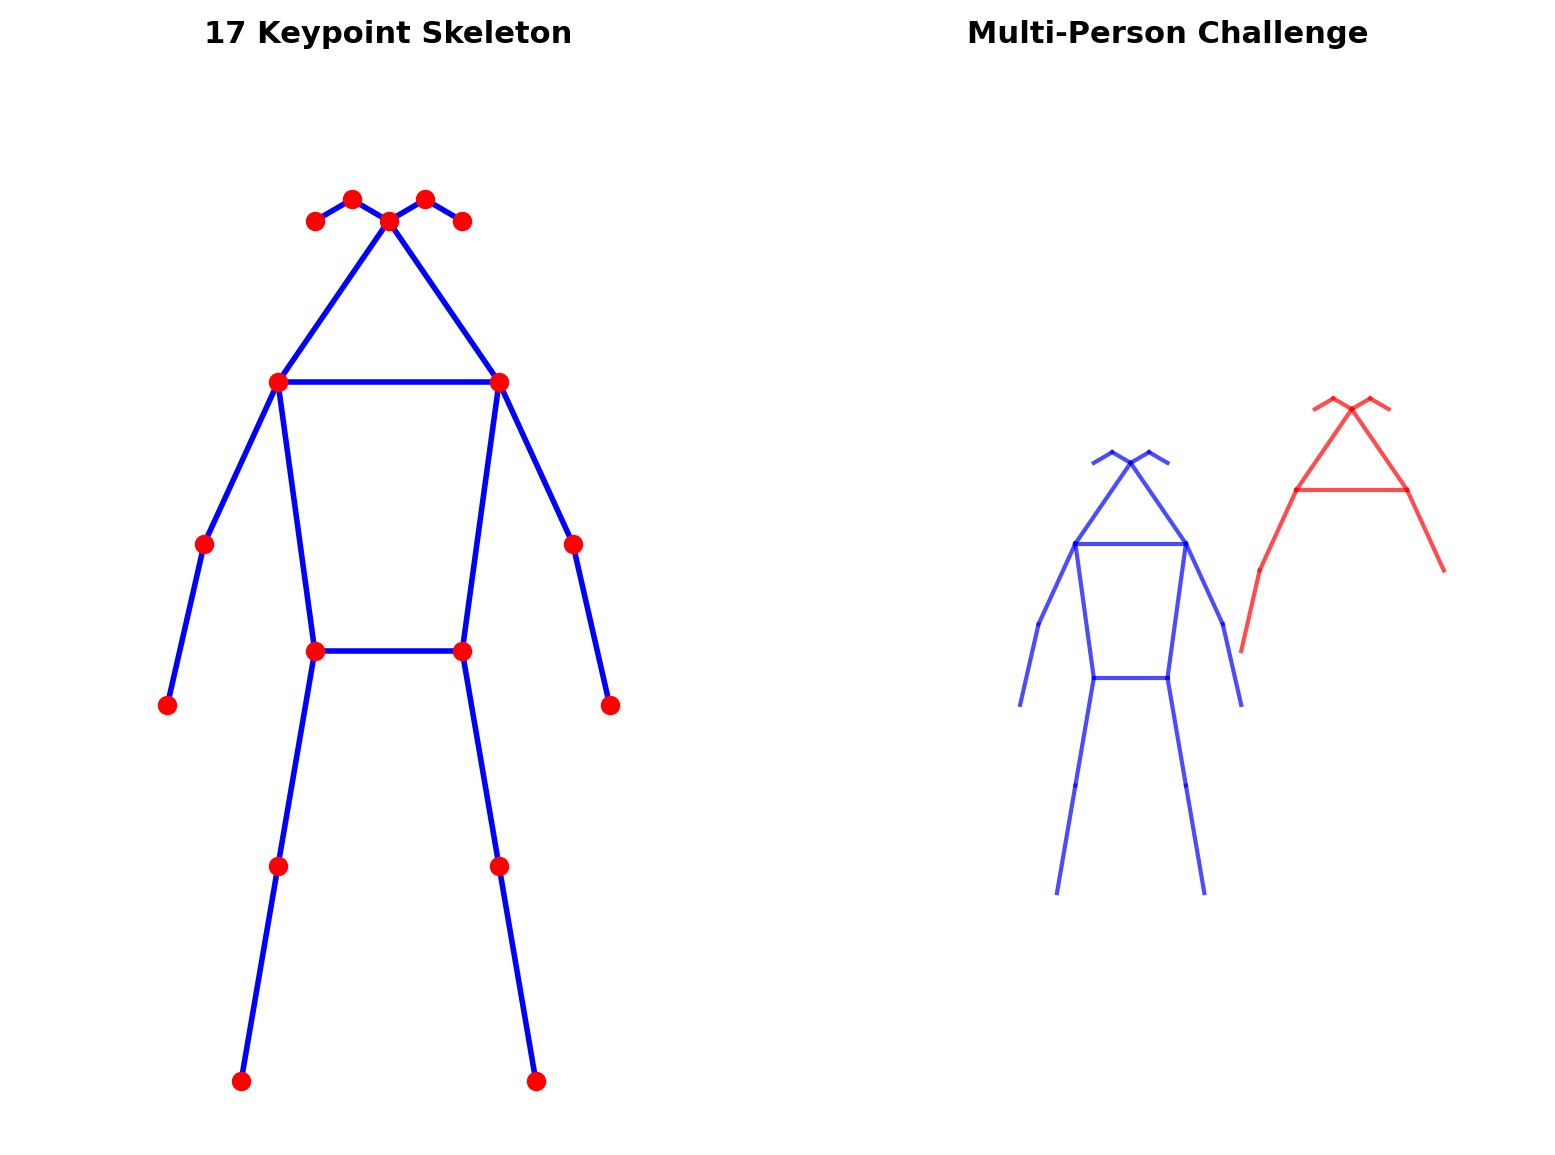
Keypoints Are a Third Output Space
Pose estimation: \(K\) named locations per person.
\[f_\theta: \mathbb{R}^{H \times W \times 3} \rightarrow \mathbb{R}^{K \times 2}\]
Task
- COCO format: \(K = 17\) - 5 facial points, 6 upper-body joints, 6 lower-body joints
- Every keypoint present or marked occluded - fixed output size
Two regimes
- Single person: \(\mathbb{R}^{K \times 2}\) - localization with no classes and no cardinality
- Multi-person: \(\mathcal{P}(\mathbb{R}^{K \times 2})\) - the set problem returns
Uses
- Action recognition, motion capture, sports and clinical analysis
Direct Regression Predicts Two Numbers per Keypoint
\[\hat{p}_k = f_\theta(I) \in \mathbb{R}^2 \qquad \mathcal{L} = \sum_{k=1}^{K} \|\hat{p}_k - p_k^*\|^2\]
Structure
- Backbone, global pooling, fully connected head to \(2K\) values
- Global pooling removes the spatial grid before prediction
Properties
- Compact: 34 output values for \(K = 17\)
- Differentiable end to end - no decoding step
- One point estimate per keypoint, by construction
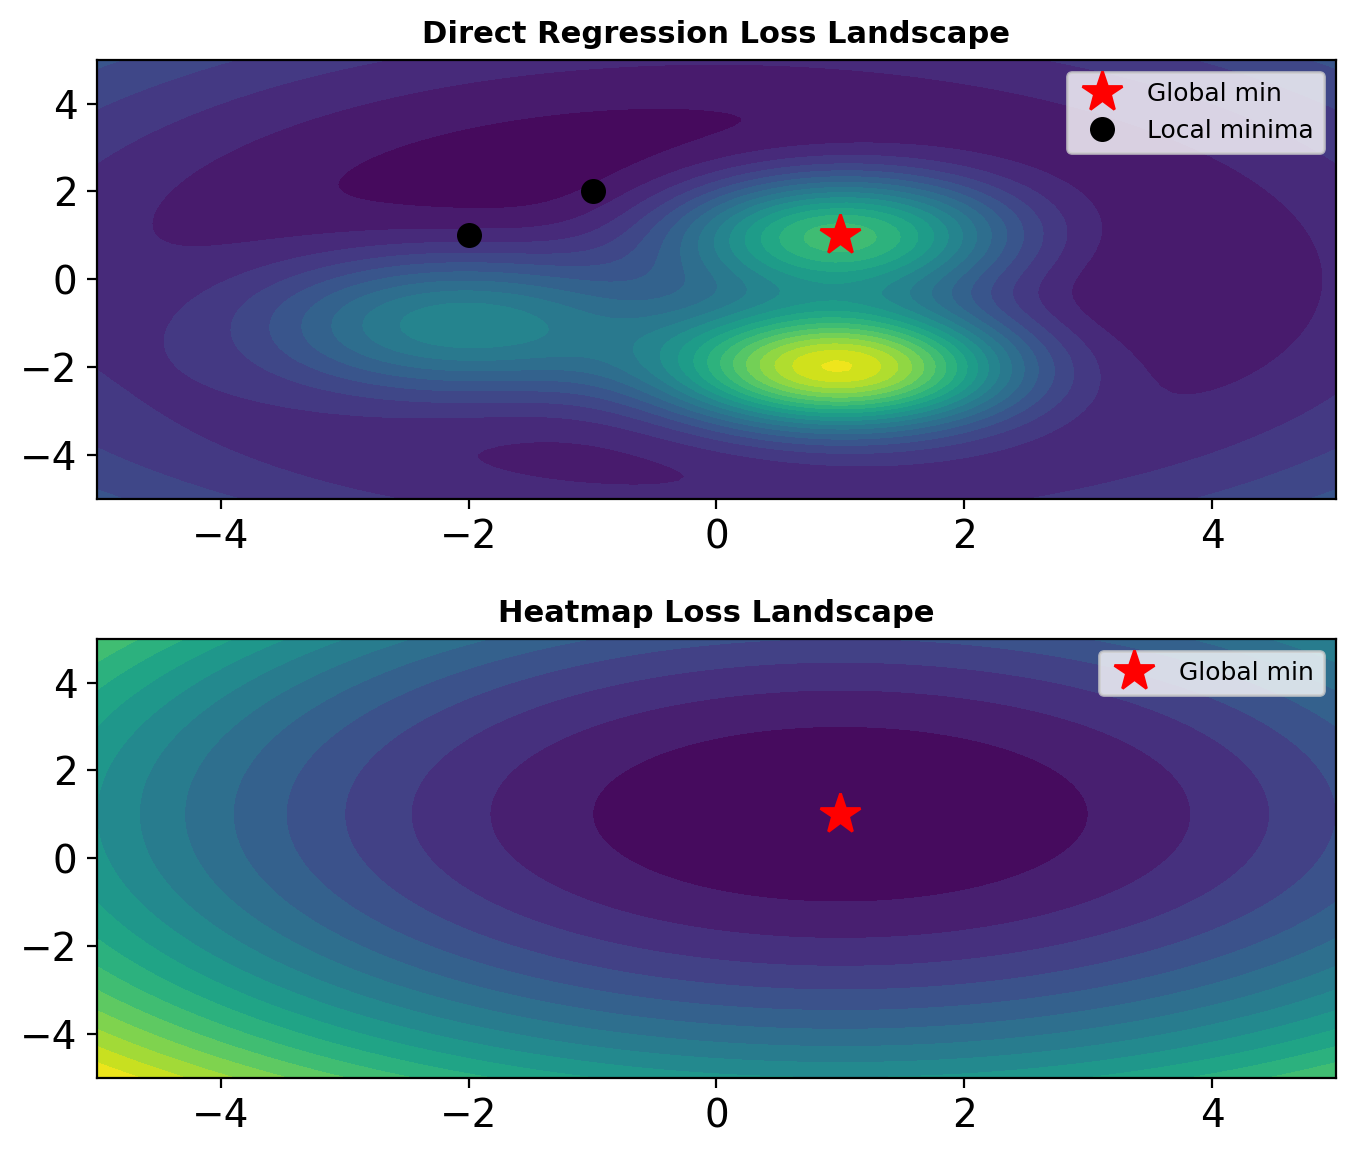
L2 on Coordinates Averages Ambiguous Poses
Ambiguity
- An occluded wrist has several plausible positions - two modes 60 px apart, equally likely
- A coordinate output holds one point - two modes have no encoding
L2 fits the posterior mean
- The L2-optimal estimator is the posterior mean - the MMSE estimator, correct under unimodal noise, wrong under multimodal ambiguity
- Averaged over the two modes, the loss surface is one bowl centered between them - the minimizer sits 30 px from both plausible positions
Lost spatial structure
- Global pooling separates features from their locations
- The head recovers geometry from channel values alone
Regression scores consistently below heatmap methods on the standard pose benchmarks.
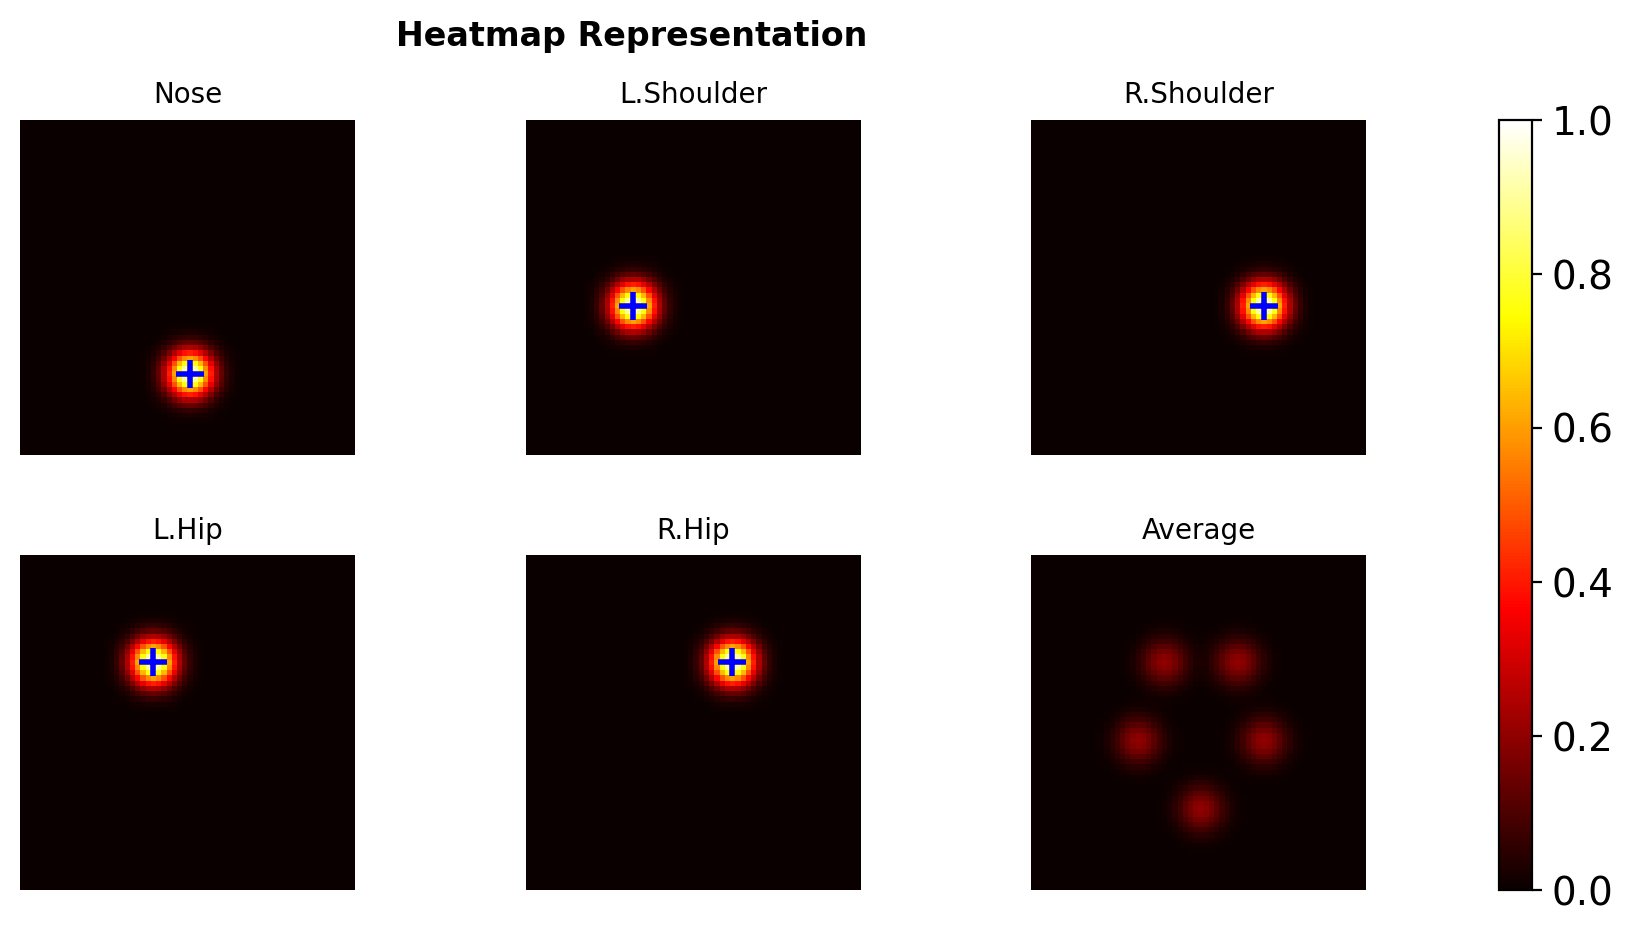
A Heatmap Scores Every Position per Keypoint
\[\hat{H} \in \mathbb{R}^{H' \times W' \times K}\]
Read \(\hat{H}_k[i,j]\) as the probability that keypoint \(k\) lies at \((i,j)\) - a spatial distribution over the map.
Targets
- One channel per keypoint, a Gaussian at the true location:
\[G_k(p) = \exp\!\left(-\frac{\|p - p_k^*\|^2}{2\sigma^2}\right)\]
- \(\sigma \approx 1\)-2 px at output resolution sets the supervision trade: small \(\sigma\) concentrates the gradient near the truth, large \(\sigma\) spreads signal but blurs the peak
Loss
- Per-pixel MSE between predicted and target maps:
\[\mathcal{L} = \frac{1}{KH'W'} \sum_{k} \sum_{i,j} \left(G_k[i,j] - \hat{H}_k[i,j]\right)^2\]
- Local: each output value is supervised at its own location
Ambiguity
- Two plausible positions produce two modes of the distribution - nothing forces an average
Argmax Decoding Costs Differentiability and Resolution
\[\hat{p}_k = \arg\max_{(i,j)} \hat{H}_k[i,j]\]
Argmax takes the mode of the spatial distribution - the MAP estimate, where L2 regression fit the mean.
Resolution
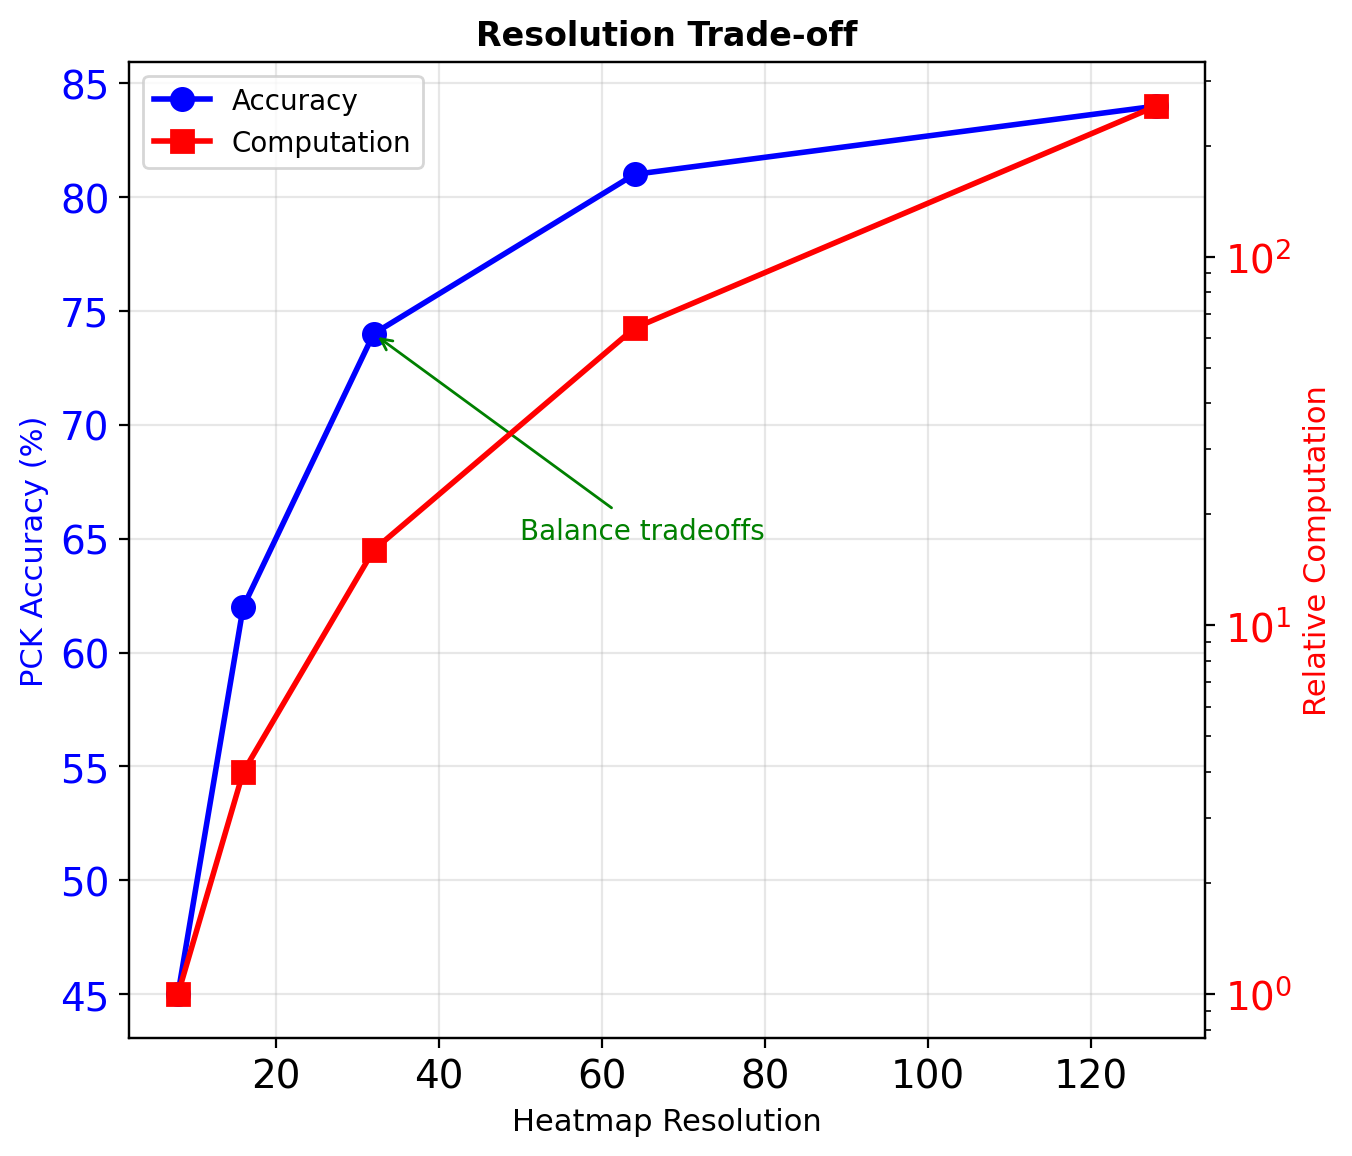
- Maps at output stride 4: argmax lands on a cell center, up to 2 px from the true location
- Sub-pixel refinement recovers part of it - a weighted average, or a Taylor step around the peak
Differentiability
- Argmax has no gradient - training supervises the map, not the decoded coordinate
- Map similarity is a proxy for the localization error that is evaluated
Size
- \(64 \times 64 \times 17\) maps: 69,632 output values against regression’s 34
Encoder-Decoder Recovers the Output Resolution
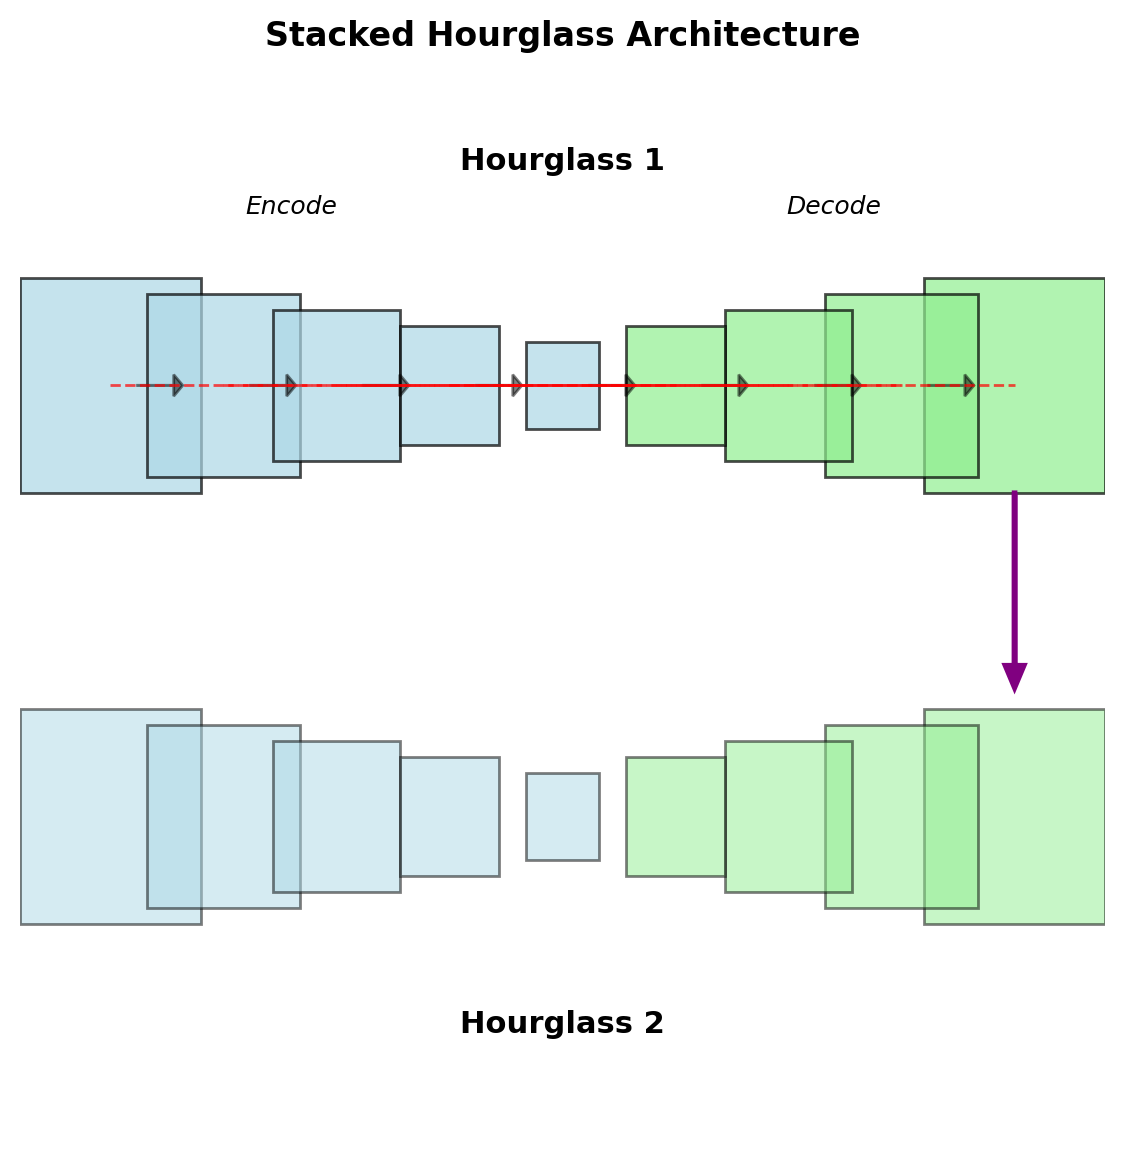
Backbone features sit at \(H/32\). Heatmaps are wanted near input resolution.
Hourglass
- Downsample: the receptive field grows to cover the figure - enough context to tell left wrist from right
- Upsample: resolution returns for precise placement
- Skip connections: detail lost to downsampling rejoins the upsampling path
Stacking
- 2-8 hourglasses in sequence, each refining the previous maps
- Intermediate supervision - the heatmap loss at every stage:
\[\mathcal{L} = \sum_{t=1}^{T} \mathcal{L}_t\]
The same resolution recovery returns with semantic segmentation.
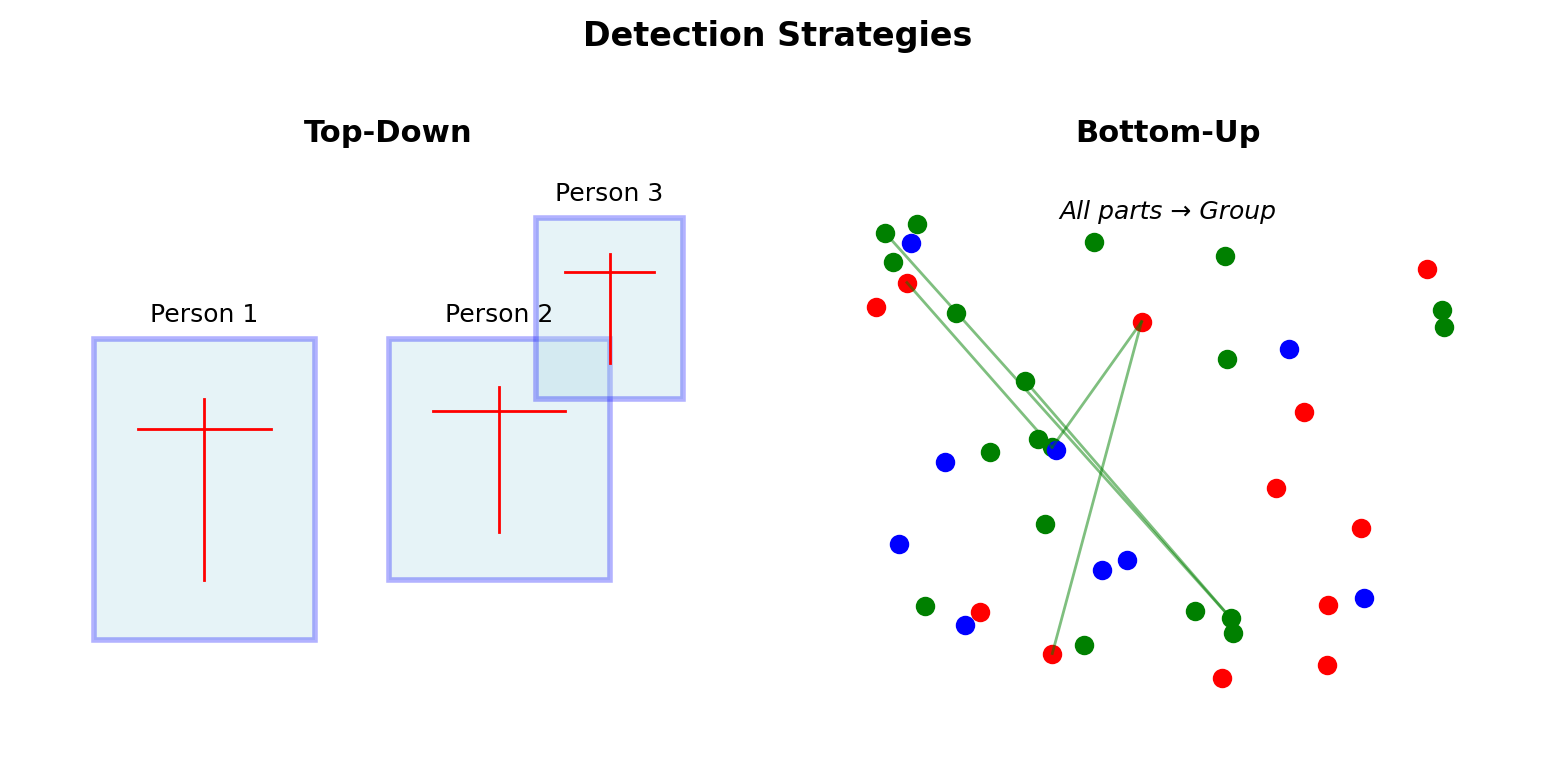
Multi-Person Pose Runs People-First or Parts-First
Top-down - people first
- Detect person boxes (a person detector - detection sections), crop, run single-person pose on each crop
- Cost scales with the person count: \(O(N \cdot T_{pose})\)
- A person the detector misses has no pose
Bottom-up - parts first
- Detect every keypoint of every person in one dense pass
- Group keypoints into people afterward - the association problem
- One fixed-cost pass, then association whose cost grows with \(N\)
Person count and crowding set which decomposition is cheaper.
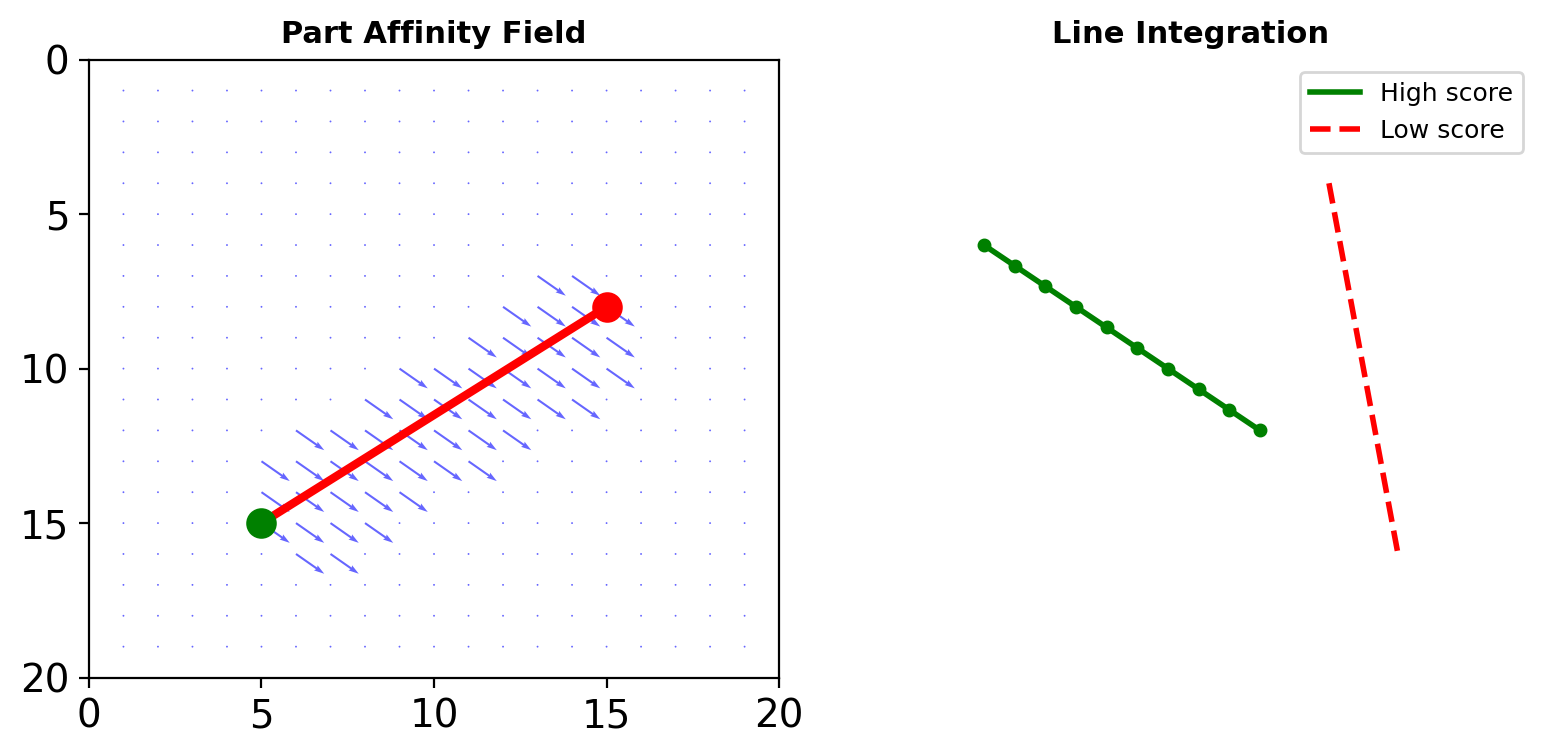
Part Affinity Fields Score Candidate Limbs
Grouping needs evidence that two keypoints belong to one person. Part affinity fields (PAFs) turn the limb between them into that evidence.
Field
- One 2-channel vector field per limb type - a unit vector along the limb at on-limb pixels, zero elsewhere:
\[\mathbf{L}(p) = \begin{cases} \mathbf{v} & p \text{ on the limb} \\ \mathbf{0} & \text{otherwise} \end{cases} \qquad \mathbf{v} = \frac{j_2 - j_1}{\|j_2 - j_1\|}\]
- A dense map again - the heatmap representation, carrying direction instead of presence
Score
- Line integral of field alignment between two candidates:
\[E = \int_0^1 \mathbf{L}(p(u)) \cdot \frac{d_{j_2} - d_{j_1}}{\|d_{j_2} - d_{j_1}\|} \, du\]
- Sampled at fixed points in practice
- High when the sampled field runs along the candidate connection, near zero across people
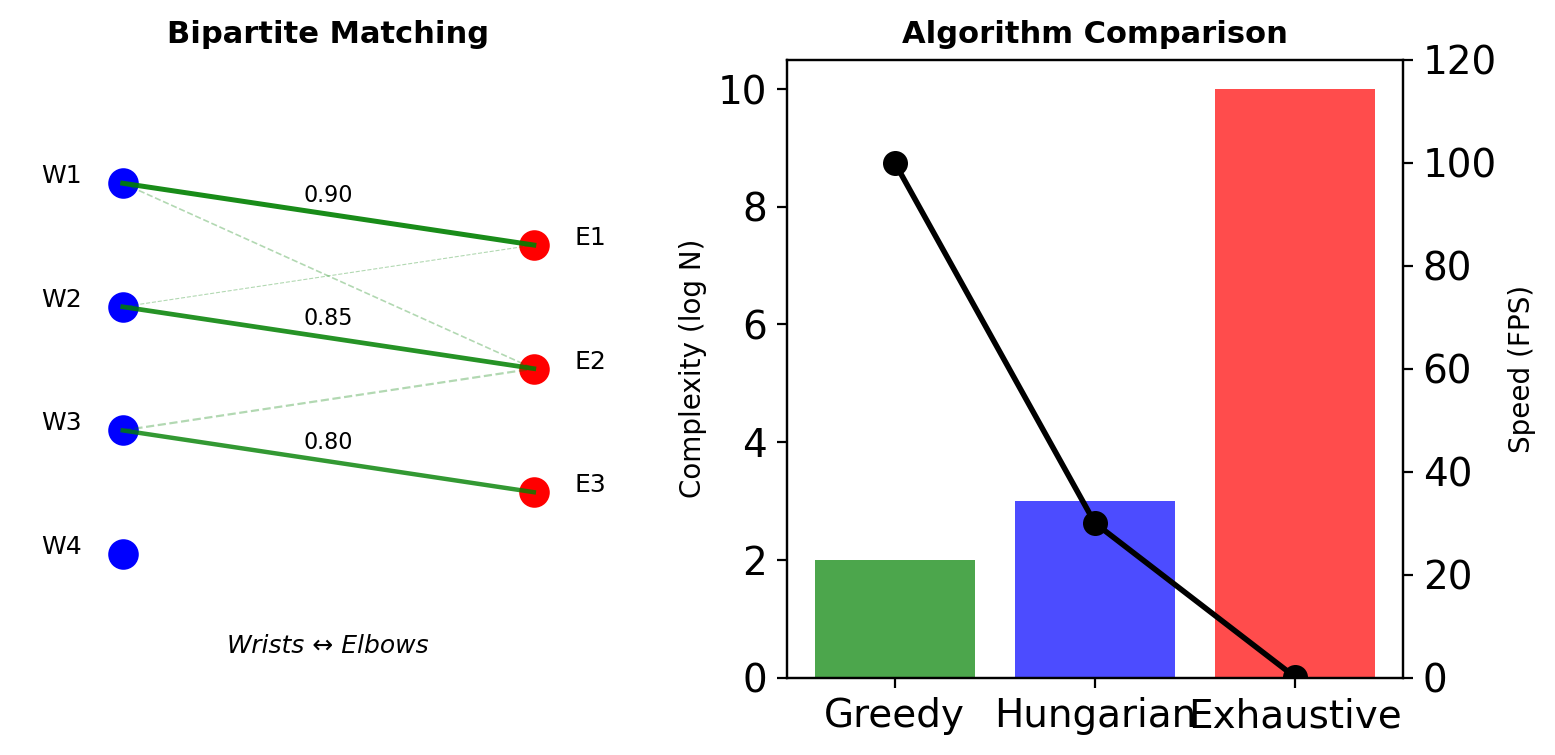
Grouping Keypoints Is Bipartite Matching
Per limb type: connect candidate joints so that no candidate is used twice and the summed PAF score is maximal.
\[\max \sum_{c \in \mathcal{C}} \sum_{(j_1, j_2) \in c} E_{j_1 j_2}\]
Per-limb matching (\(N\) = candidates per joint for that limb)
- Hungarian algorithm: optimal, \(O(N^3)\)
- Greedy by descending score: \(O(N^2 \log N)\), near-optimal in practice - OpenPose uses greedy
The full problem
- Whole-body assignment over all limb types at once is NP-hard
- Per-limb decomposition along the skeleton tree is the approximation that makes it tractable
The same bipartite matching, Hungarian included, returns with set-prediction detectors.
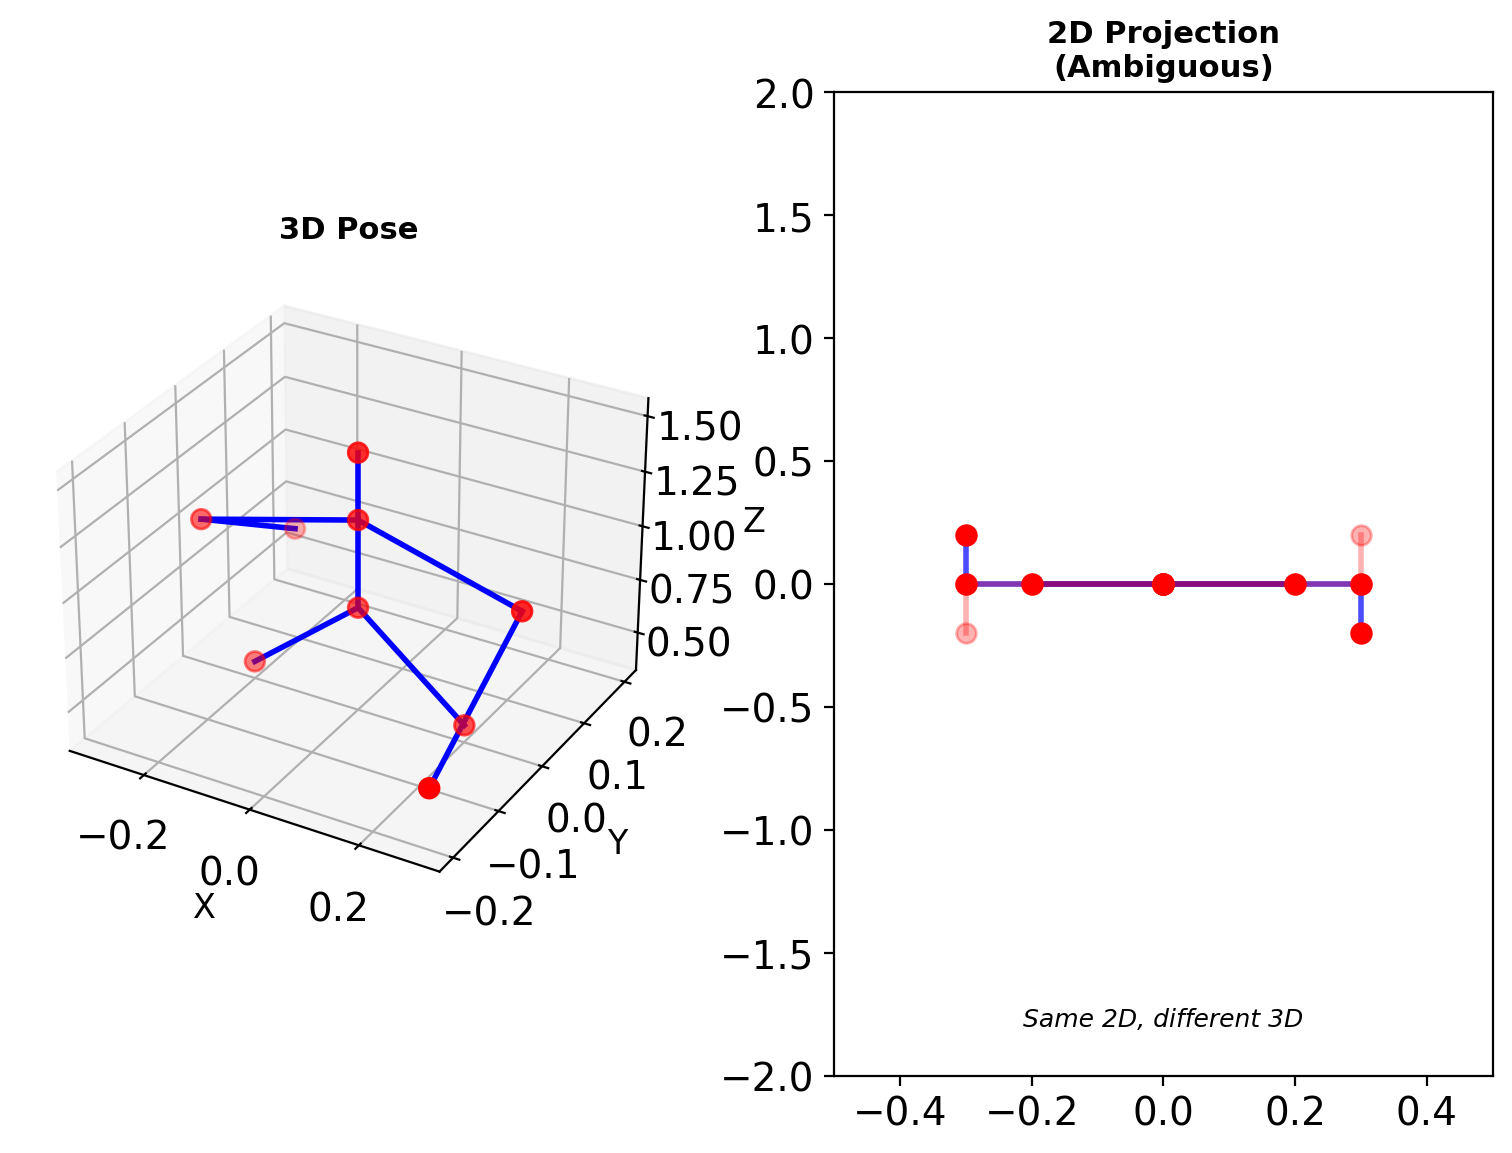
Depth Is Unobserved in a Single View
\[\pi(P_{3D}) = p_{2D}\]
Ambiguity
- Many 3D poses project to the same 2D pose
- Resolved only by priors on the body or by additional views
Lifting
- Estimate 2D pose, then a learned map from \(\mathbb{R}^{K \times 2}\) to \(\mathbb{R}^{K \times 3}\)
- Small, fast, works on top of any 2D estimator
Volumetric heatmaps
- The heatmap representation with a depth axis: \(\mathbb{R}^{H \times W \times D \times K}\)
- Memory grows by the factor \(D\)
Volumetric heatmaps carry the regression-versus-map trade into 3D.
Region-Based Detectors Propose, Then Classify
Detection in two stages: a class-agnostic proposal stage, then a classifier over its regions.
Propose
- ~10³ class-agnostic regions per image, chosen for high recall
- Bottom-up grouping of color, texture, and shape (selective search)
- Recall matters most - a later stage can reject a region, not recover one
Classify
- Each proposed region gets a class and a refined box
- ~10³ candidates instead of 10⁶ grid windows - a 1000× larger per-candidate budget
- The larger budget allows a full CNN per region
A missed object in the proposal stage is unrecoverable.
R-CNN Classifies Each Proposal Independently
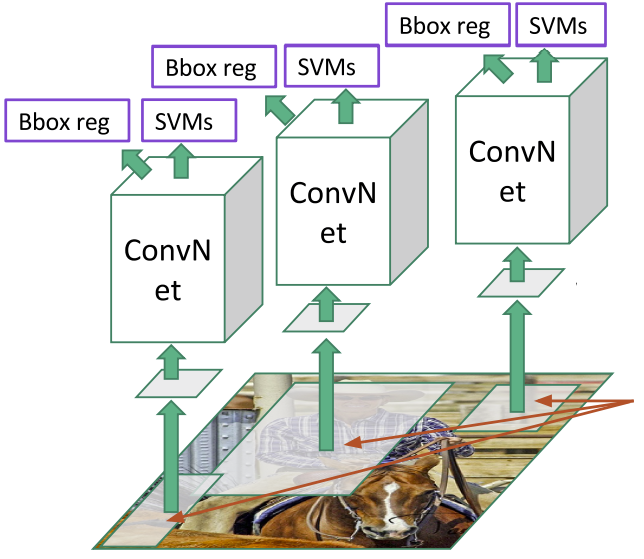
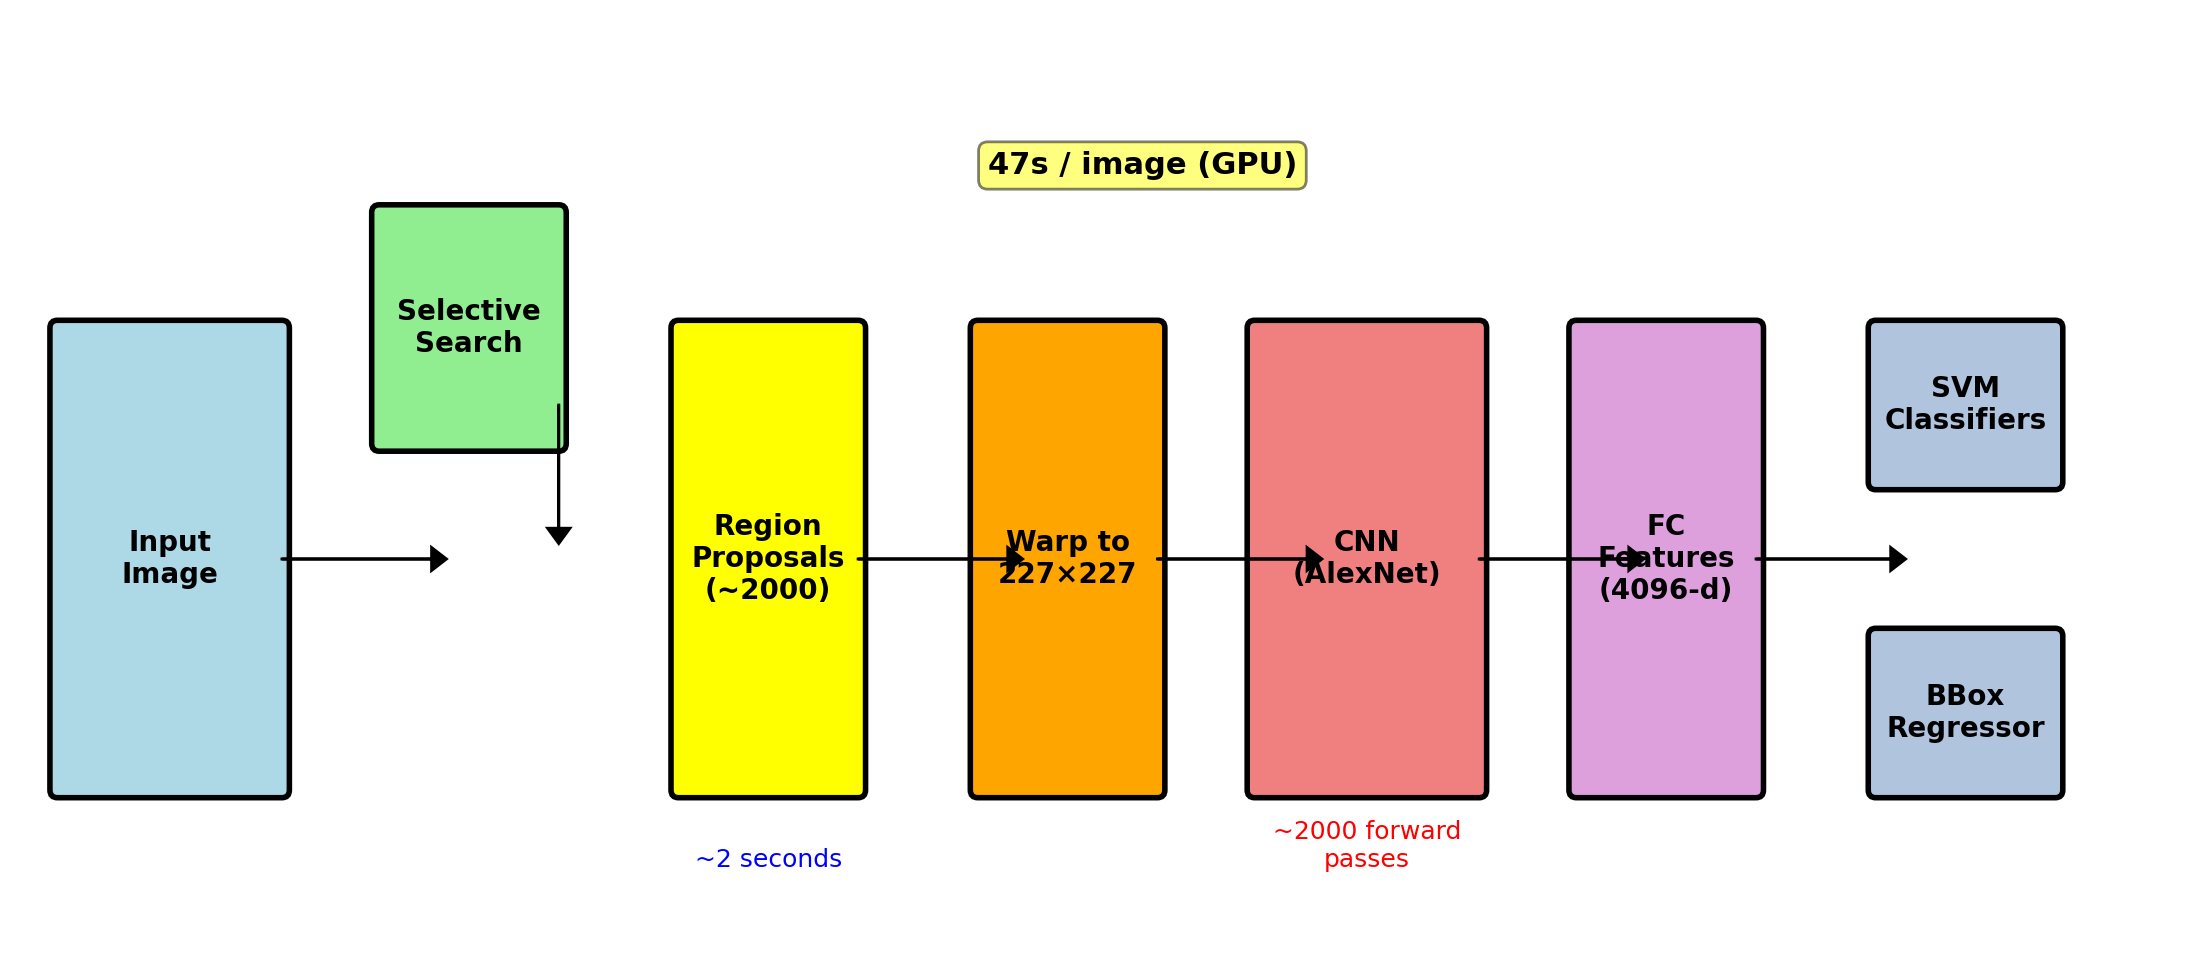
Figure: Girshick et al., 2014.
The first CNN detector (2014):
- Selective search - ~2,000 proposals
- Warp each region to 227×227
- One CNN forward pass per region (AlexNet)
- Per-class SVM scores each feature vector
- Ridge regression refines each box
The loop body is a full network evaluation. No computation is shared between overlapping regions.
Repeated Feature Extraction Dominates R-CNN Time
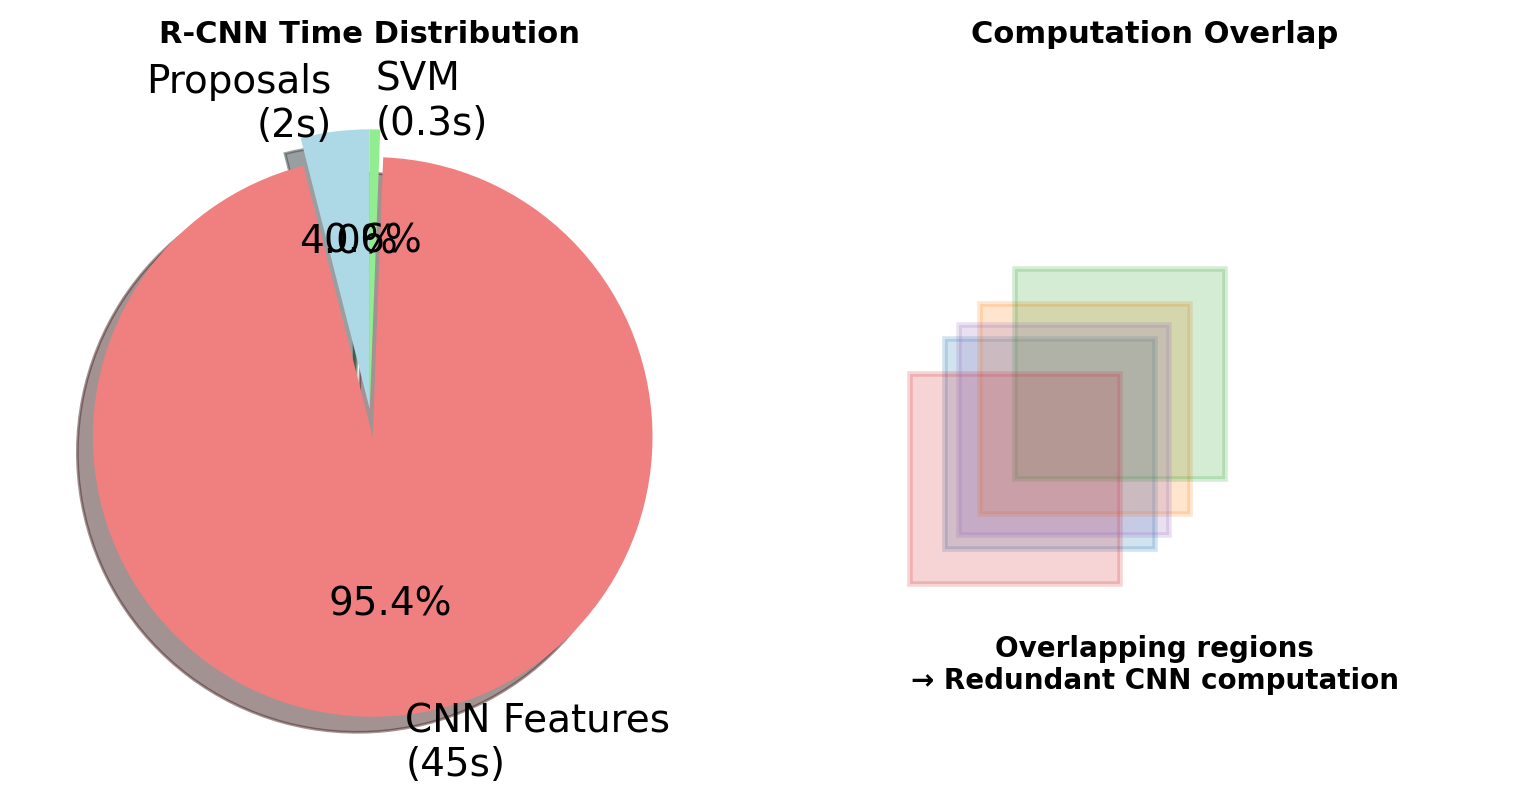
Per image: 13 s on GPU, 53 s on CPU.
- Proposals overlap heavily - the same pixels are convolved hundreds of times
- Warping each region discards the shared structure one feature map would keep
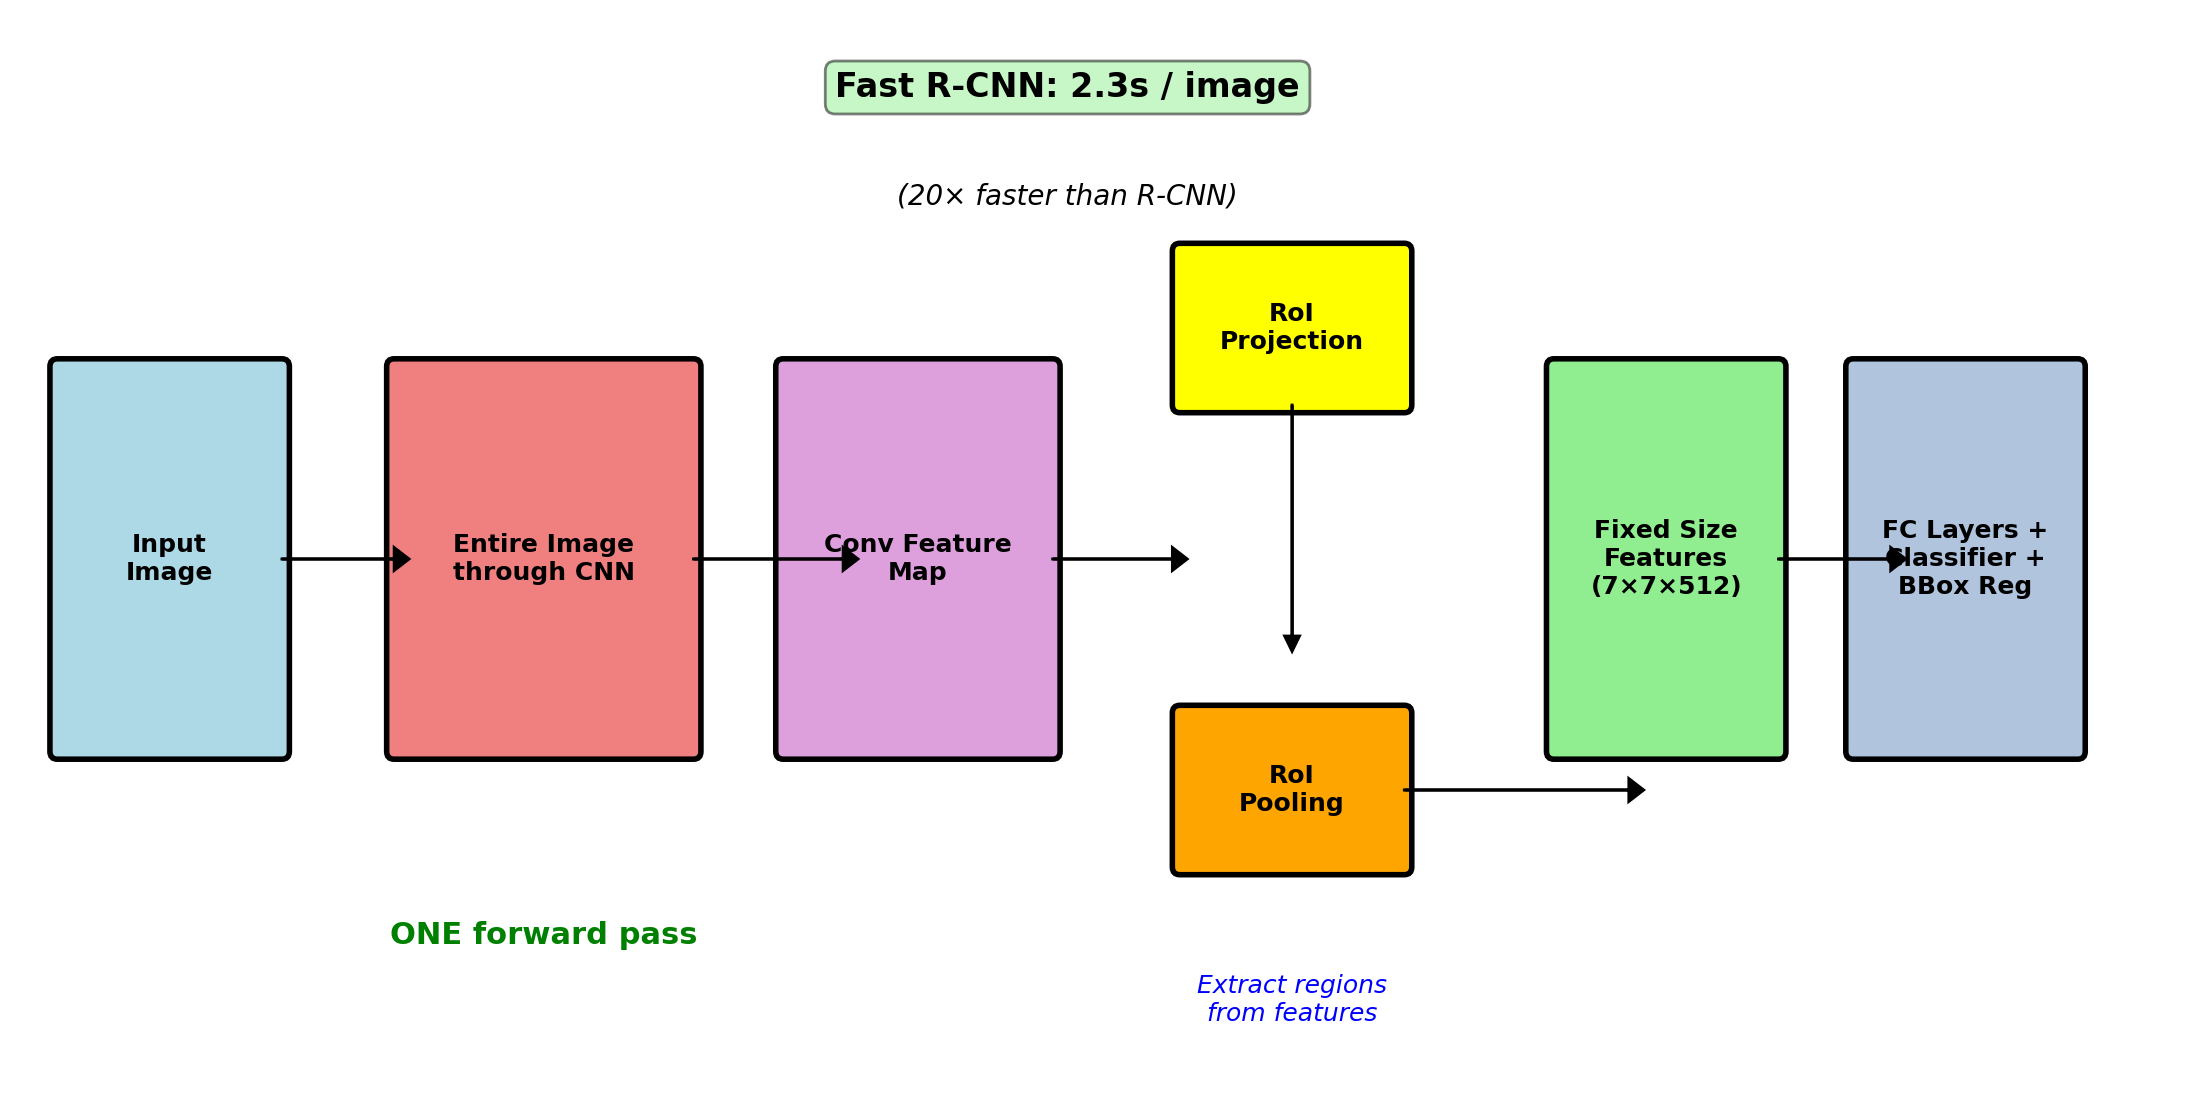
Fast R-CNN Runs the Backbone Once
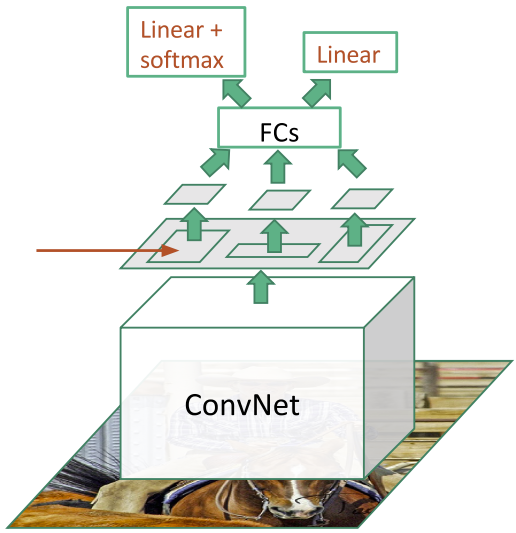
Figure: Girshick, 2015.
The 2015 revision inverts the order: one backbone pass first, regions read from its output.
- Overlapping proposals read one shared feature map
- Per-region work shrinks to pooling plus two small heads
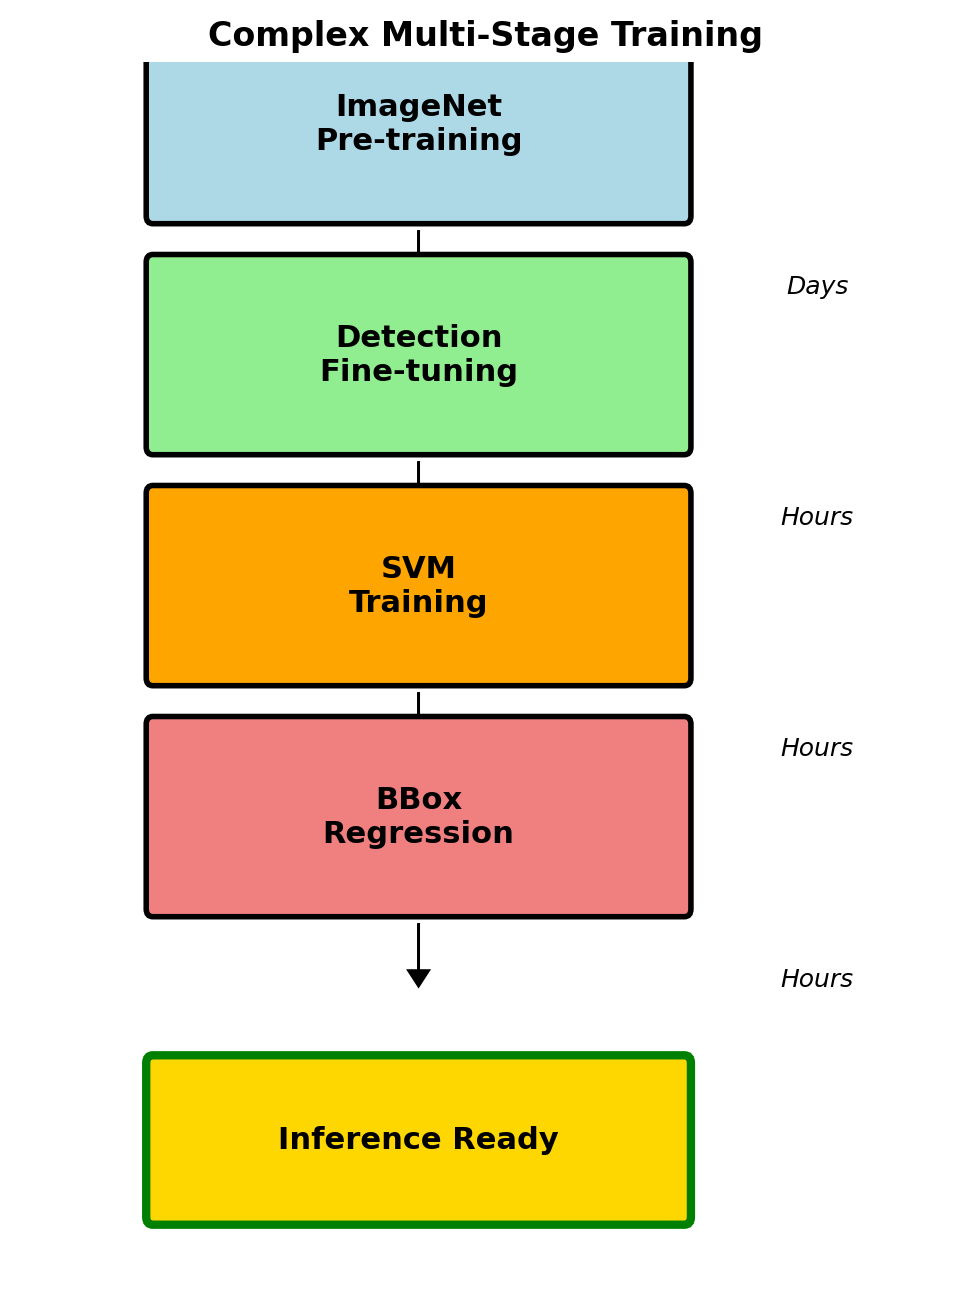
| R-CNN | Fast R-CNN | |
|---|---|---|
| Time per image | 13 s | 0.32 s |
| VOC07 mAP | 66% | 70% |
146× faster at test time, one network instead of four training stages.
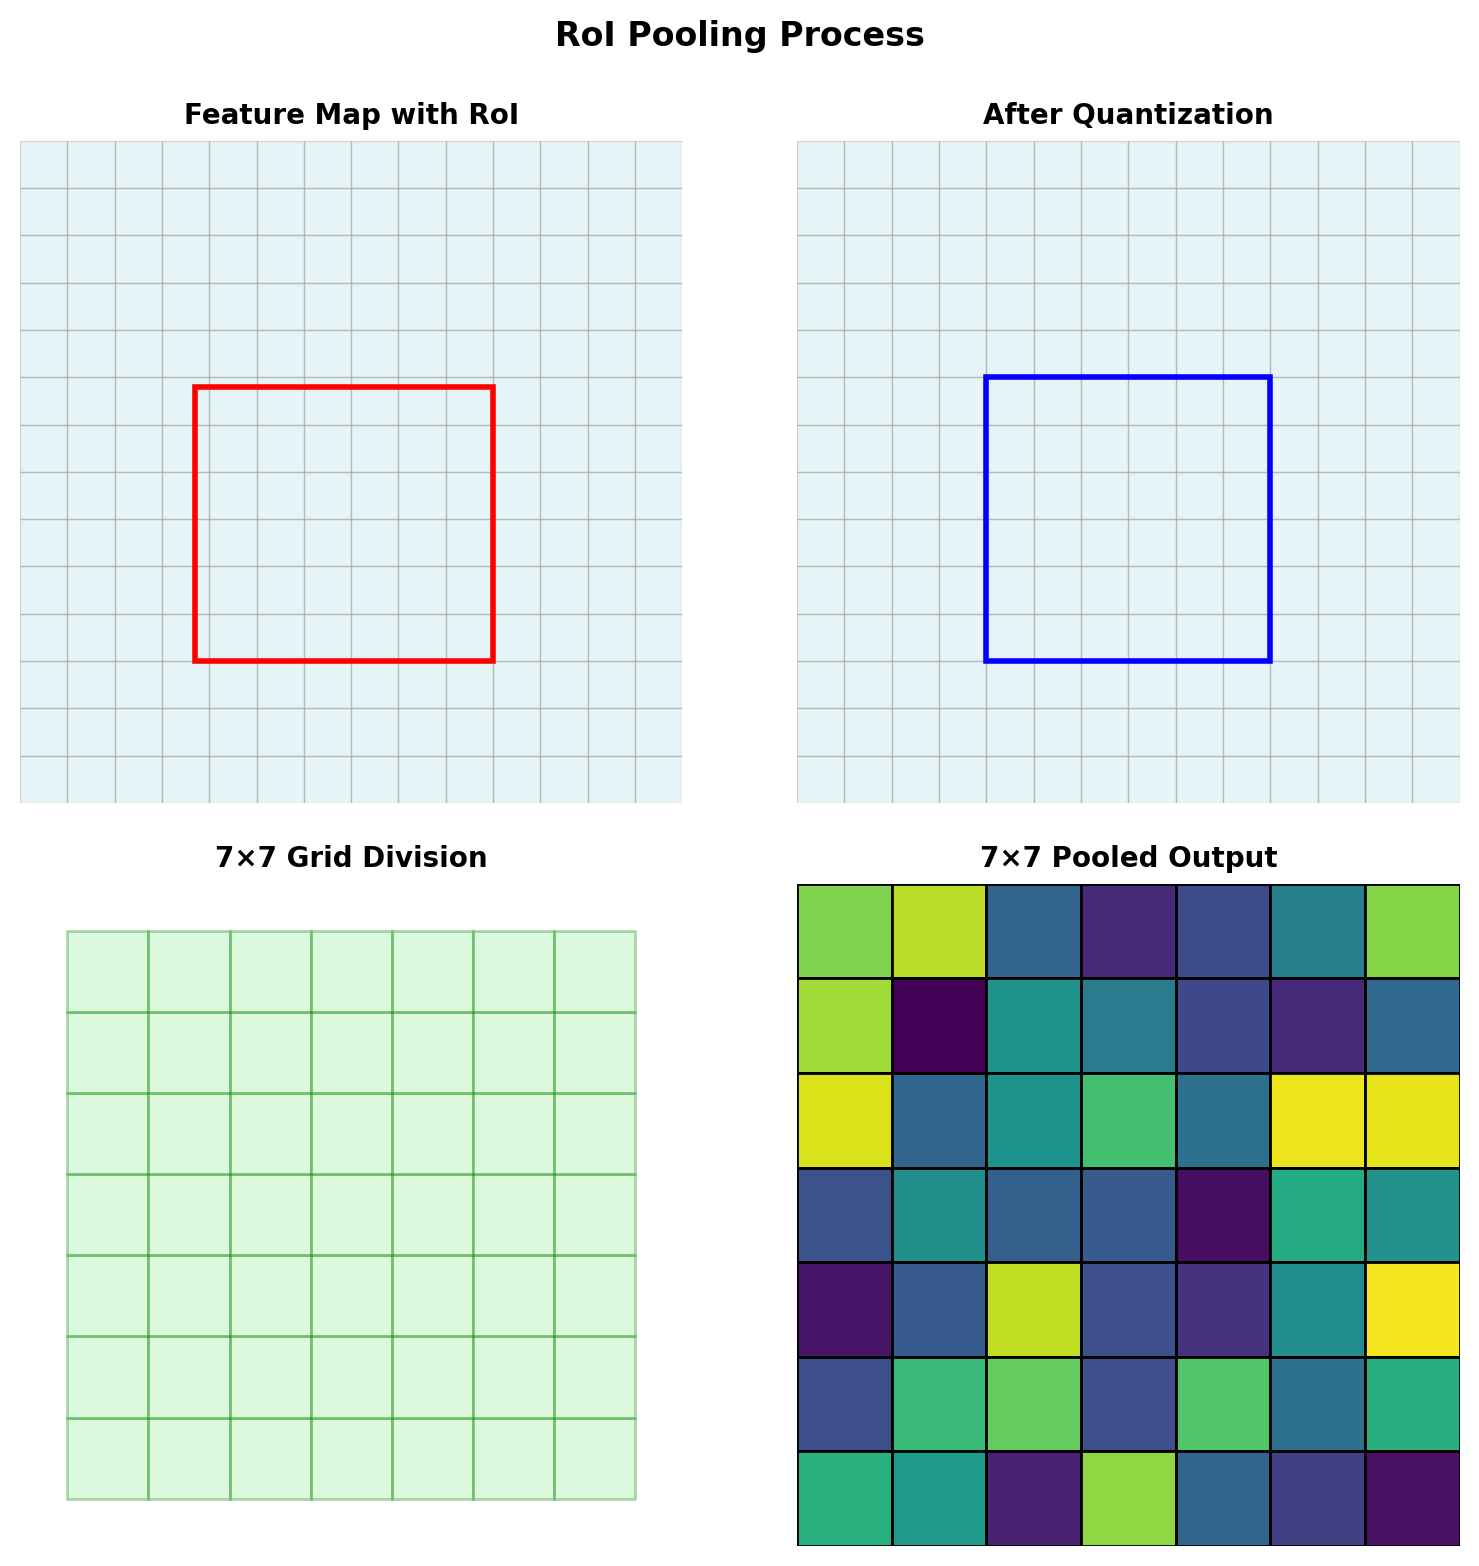
Fast R-CNN Pools Each Region to 7×7
Region-of-interest (RoI) pooling - the heads require fixed-size input, and proposals come in every size.
Operation
- Project the region to feature coordinates: divide by stride
- Divide the projected region into a 7×7 grid
- Max-pool each grid cell
Output: \(7 \times 7 \times C\) for any input region.
Quantization
- Both steps round to whole cells: \(\tilde{x} = \lfloor x / \text{stride} \rfloor\)
- Up to stride/2 px of misalignment per edge - 8 px at stride 16
- The shift is tolerable for classification but not for per-pixel output - resolved by RoIAlign with Mask R-CNN (segmentation section)
Fast R-CNN Trains with One Joint Loss
\[L(p, u, t^u, v) = L_{cls}(p, u) + \lambda\,[u \geq 1]\, L_{loc}(t^u, v)\]
The two-term detection loss, instantiated:
- \(L_{cls}\) - cross-entropy over \(C{+}1\) classes, background included
- \([u \geq 1]\) - label assignment by proposal IoU, ≥ 0.5 positive: this detector’s rule
- \(L_{loc}\) - smooth L1 on the four normalized offsets, positives only
What joint training changes
- Gradients reach the backbone - the features tune for detection, where the SVMs trained on frozen features and could not
- One definition of positive - the fine-tune/SVM mismatch leaves with the stages
- No feature cache - the hundreds of GB were an artifact of stage separation
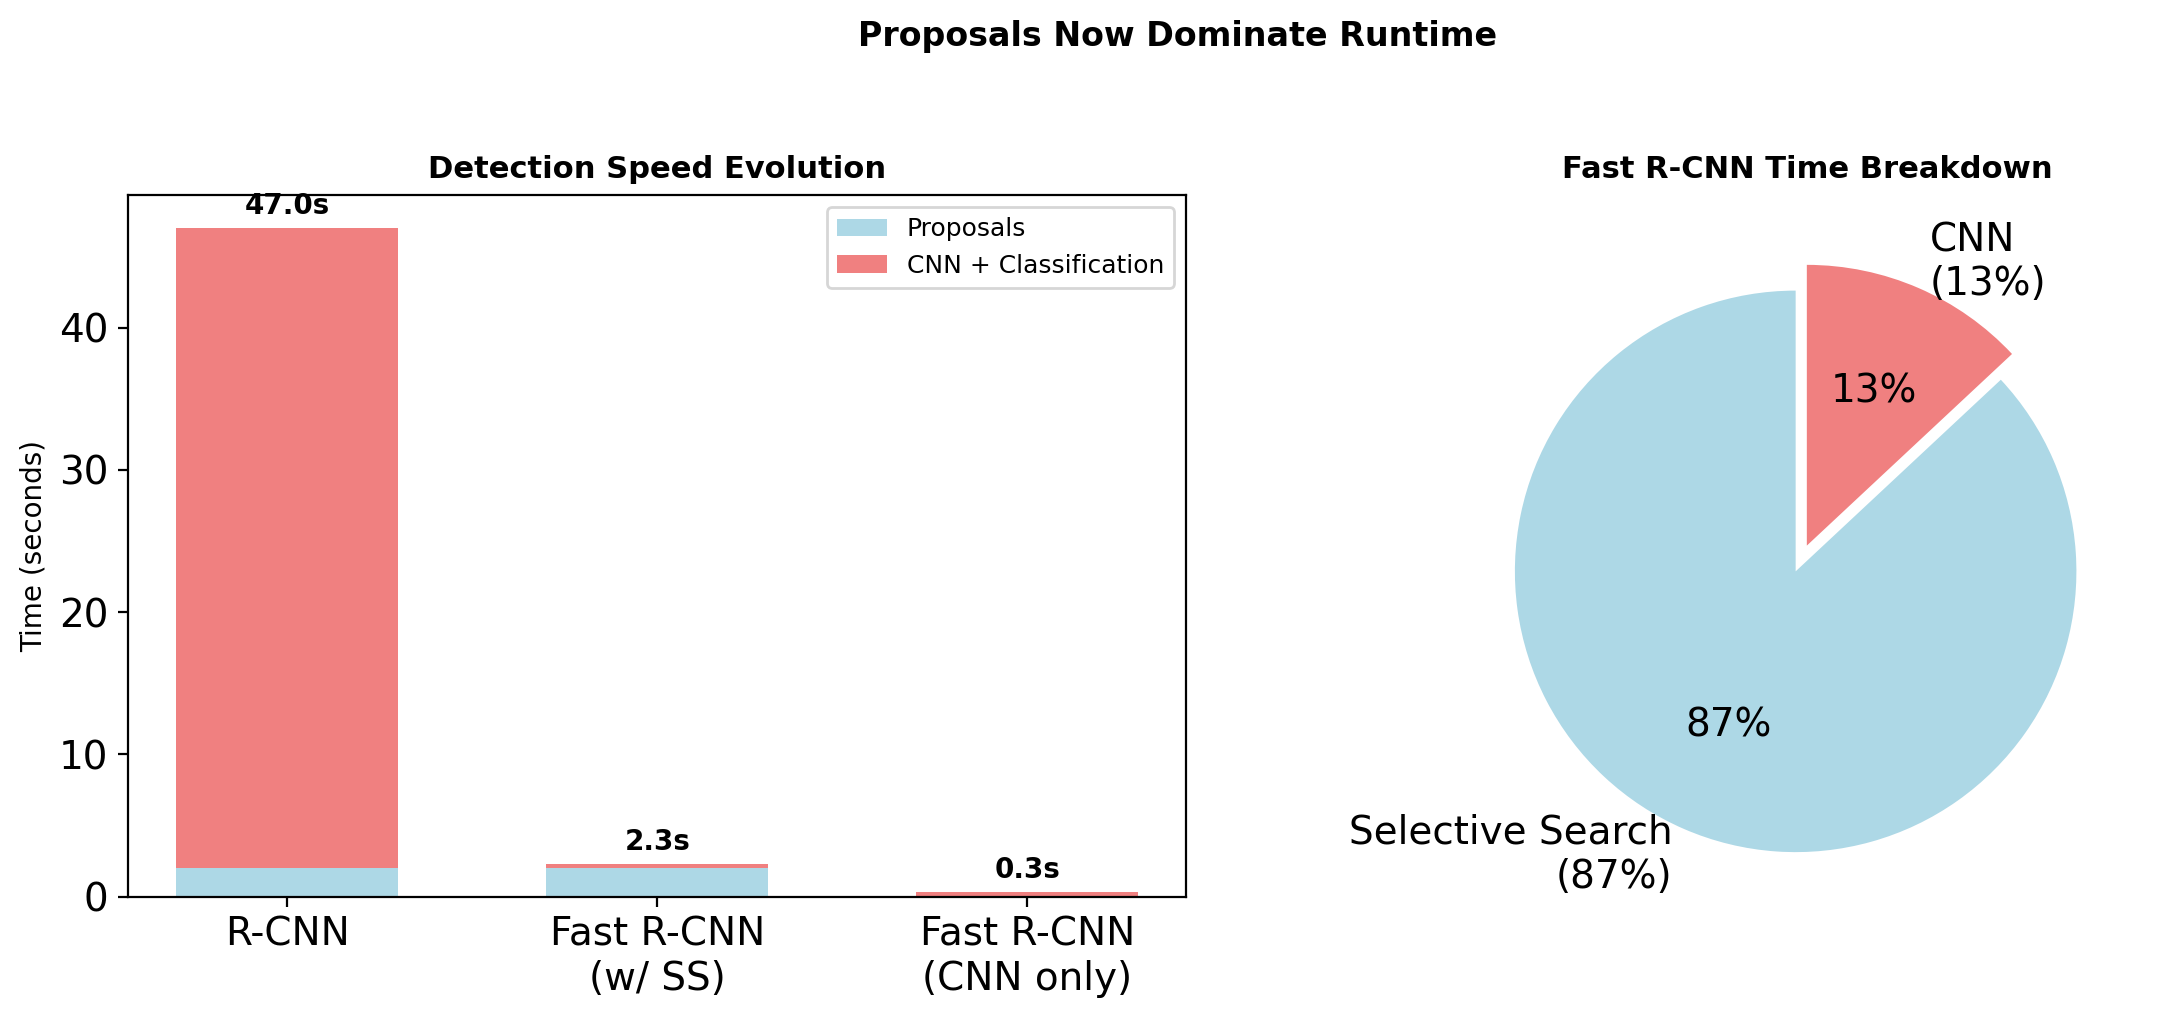
Selective Search Costs More than Fast R-CNN
After the Fast R-CNN speedup, selective search takes 2 s and everything else 0.32 s.
What remains fixed
- Hand-crafted grouping, on CPU - training does not improve it
- Proposal quality caps recall - an object selective search misses is never scored
Object-or-not is a simpler task
- Object-or-not over coarse boxes - a simpler decision than the detection head already makes
- The shared feature map holds the evidence a proposal stage needs
Faster R-CNN Proposes from the Feature Map
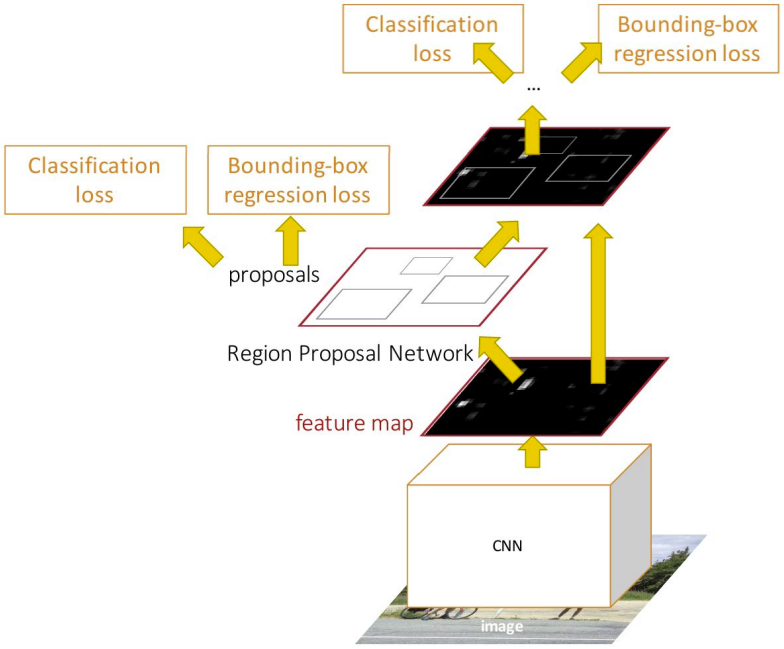
Figure: Stanford CS231n (Li, Johnson, Yeung).
Faster R-CNN (2015): the region proposal network (RPN) - proposals from the shared feature map.
RPN
- 3×3 conv over the feature map, then two sibling 1×1 heads per position
- \(k\) reference boxes (anchors) per position, preset sizes and ratios
- cls: \(2k\) objectness scores · reg: \(4k\) box offsets
- Top ~300 scored boxes become the proposals
One network, two stages
- RPN and detection head share the backbone
- Four losses train jointly: RPN cls + reg, head cls + reg
- 0.2 s per image end to end (5 FPS, VGG-16) - selective search removed
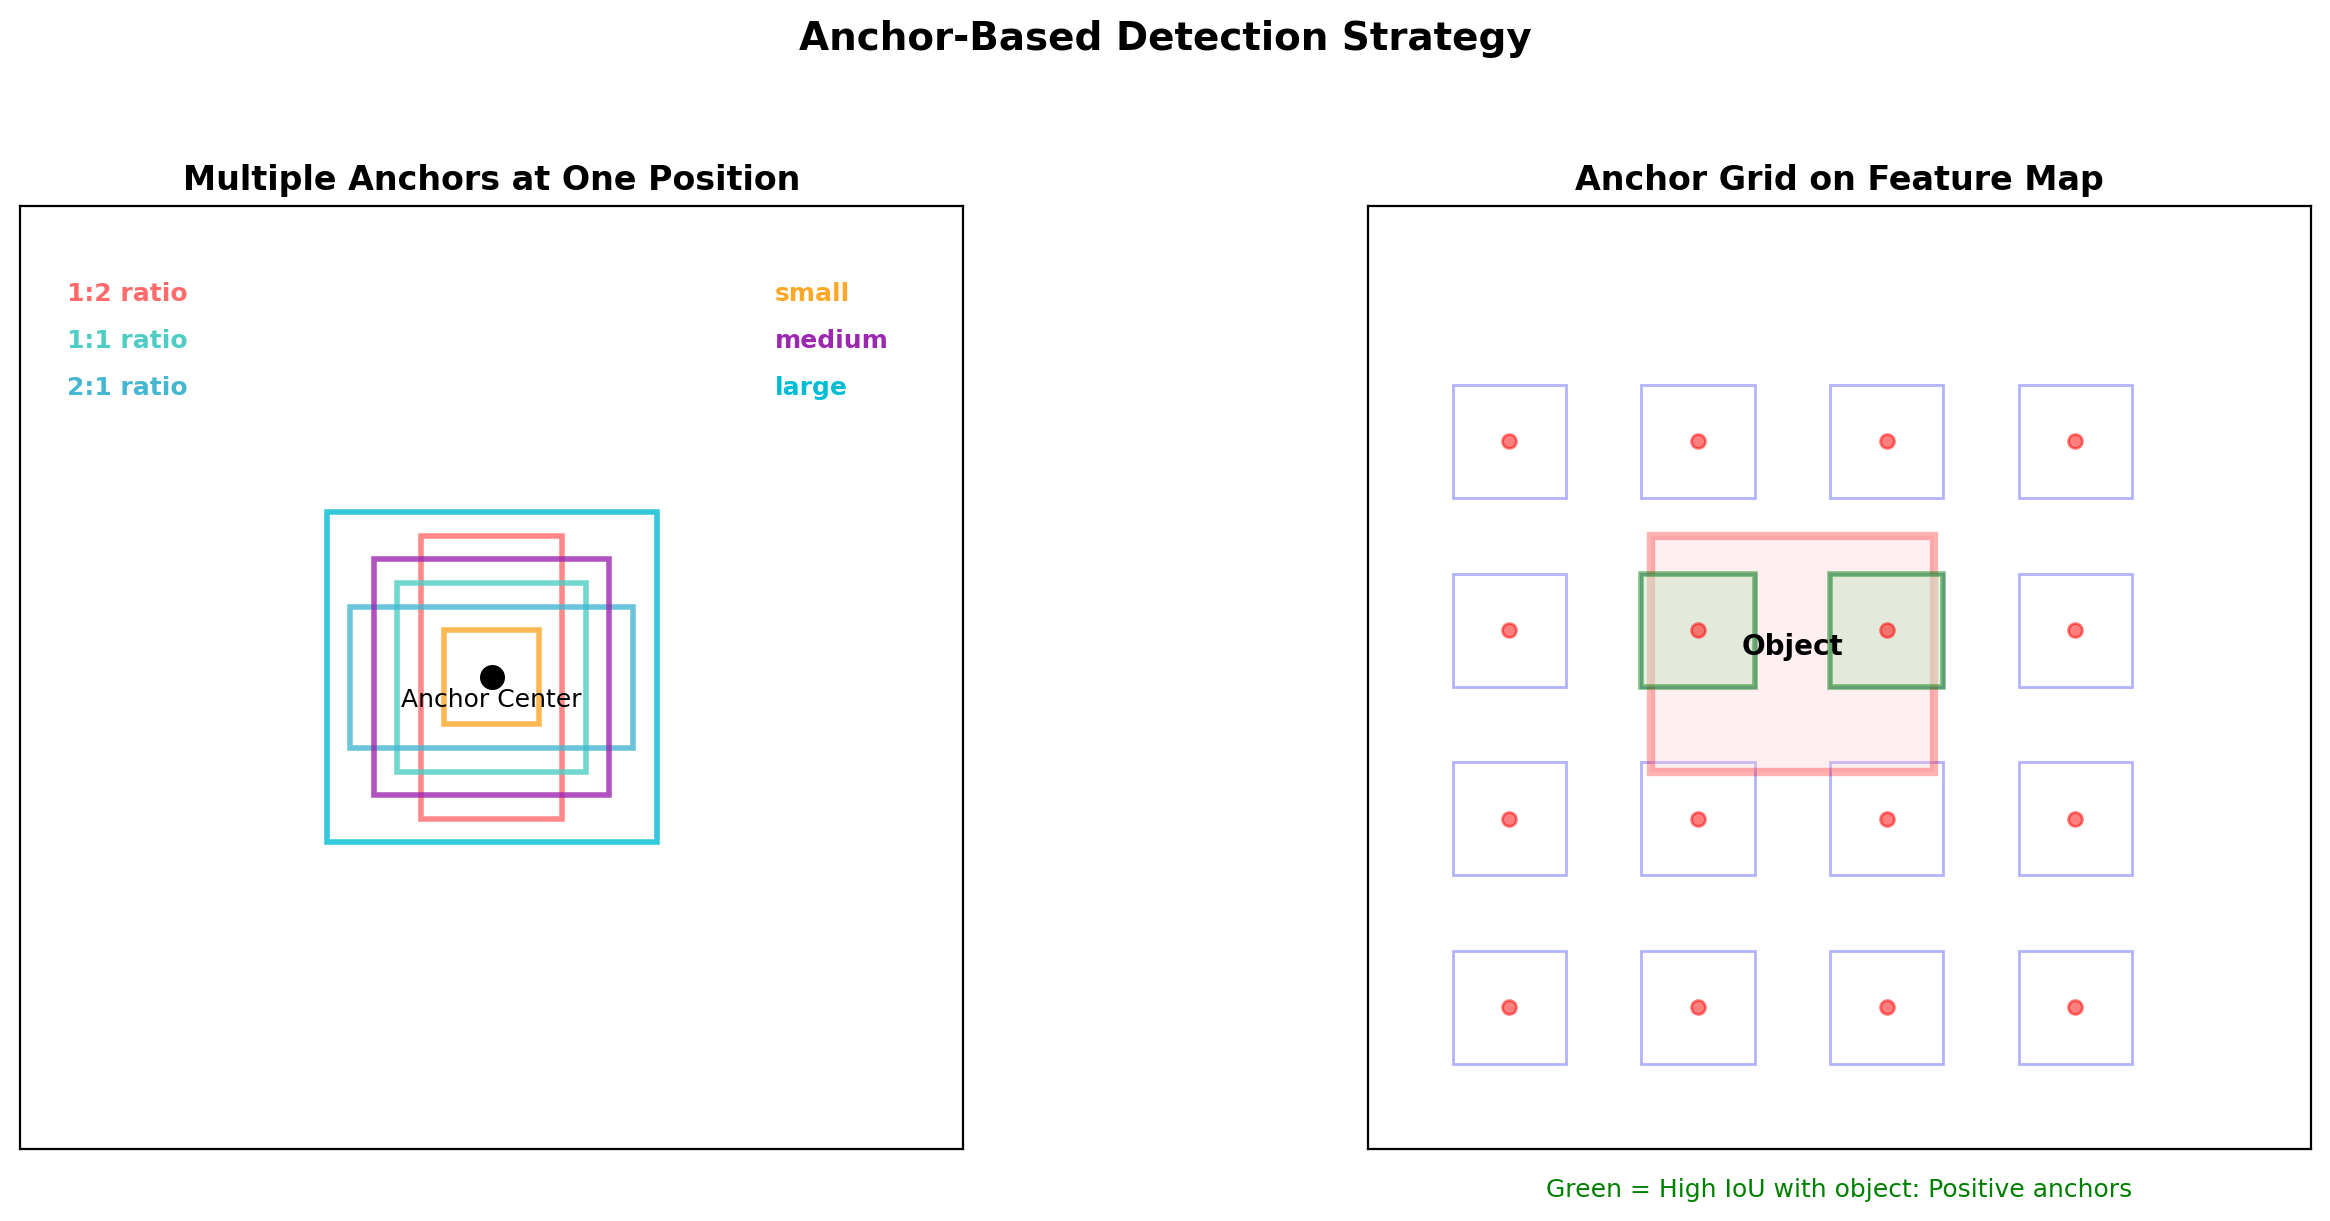
Anchors Discretize the Space of Boxes
A 1×1 conv head emits offsets. Anchors are the references the offsets refine.
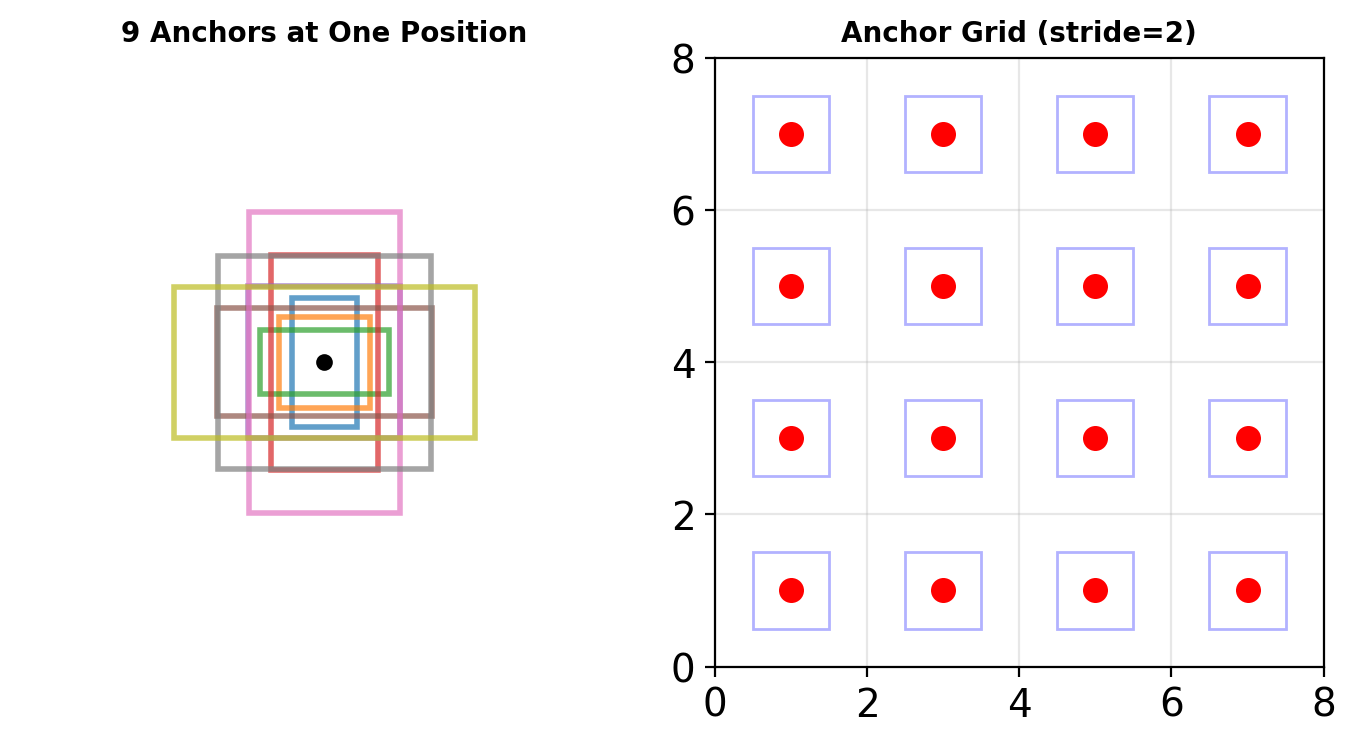
Reference set, per position
- 3 scales {128², 256², 512²} × 3 ratios {1:2, 1:1, 2:1} = 9 anchors
- ~60 × 40 positions at stride 16 on a 1000×600 input: ~20,000 anchors per image
Offset parameterization
\[t_x = \frac{x - x_a}{w_a} \quad t_y = \frac{y - y_a}{h_a} \quad t_w = \log\frac{w}{w_a} \quad t_h = \log\frac{h}{h_a}\]
- Normalized by anchor size - the scale-invariant regression target from the problem formulations
- Log for width and height - equal loss for equal relative error
Coverage
- Image pyramids rescale the input, filter pyramids widen the network - both cost computation
- Anchor pyramids reuse one feature map at test time
The RPN Labels Anchors by IoU Thresholds
The indicator of the two-term loss, instantiated for the RPN:
| Label | Rule |
|---|---|
| Positive | IoU > 0.7 with any ground truth, or the highest-IoU anchor for a ground truth |
| Negative | IoU < 0.3 against all ground truth |
| Ignored | 0.3-0.7 - contributes no loss |
Sampling
- 256 anchors per image, balanced 1:1 positive:negative - the imbalance treatment for ~20,000 mostly-negative anchors
- Binary classification only: object or not. Classes come from the second stage.
The RPN uses 0.7/0.3, Fast R-CNN’s head uses 0.5, the SVMs used 0.3 - assignment is a per-detector design decision.
Non-Maximum Suppression Keeps One Detection per Object
Non-maximum suppression (NMS) - the duplicate filter after scoring.
Why duplicates exist
- Adjacent positions and several anchors score the same object
- Each prediction is scored independently - no earlier step removes agreement
Algorithm
The threshold is a trade
- 0.5: clean output, but two true objects that overlap suppress each other
- 0.7: overlapping true objects are kept, and more duplicates pass
- \(O(N^2)\) comparisons per class
FPN Carries Deep Features to Fine Levels
Faster R-CNN pools from one map at stride 16 - one size range, with small objects below it. The feature pyramid network (FPN) supplies every range.
Two pathways
- Bottom-up: the backbone stages \(C_2\)-\(C_5\), strides 4-32 - fine levels exist but carry shallow features
- Top-down: deep features added back into every finer level, all at 256 channels:
\[P_\ell = \text{Conv}_{1\times1}(C_\ell) + \text{Upsample}(P_{\ell+1})\]
Level assignment
\[k = \lfloor k_0 + \log_2(\sqrt{wh}/224) \rfloor\]
- Small boxes pool from fine \(P_2\), large boxes from coarse \(P_5\)
- The stride and receptive-field bounds from the problem formulations, answered level by level
Evidence
- COCO gains concentrate in AP\(_S\) - the objects one stride-16 map cannot resolve
Backbone, Neck, and Head Compose a Detector
Faster R-CNN + FPN in three replaceable parts:
Backbone
- Pretrained classification network, headless - ResNet-50 here
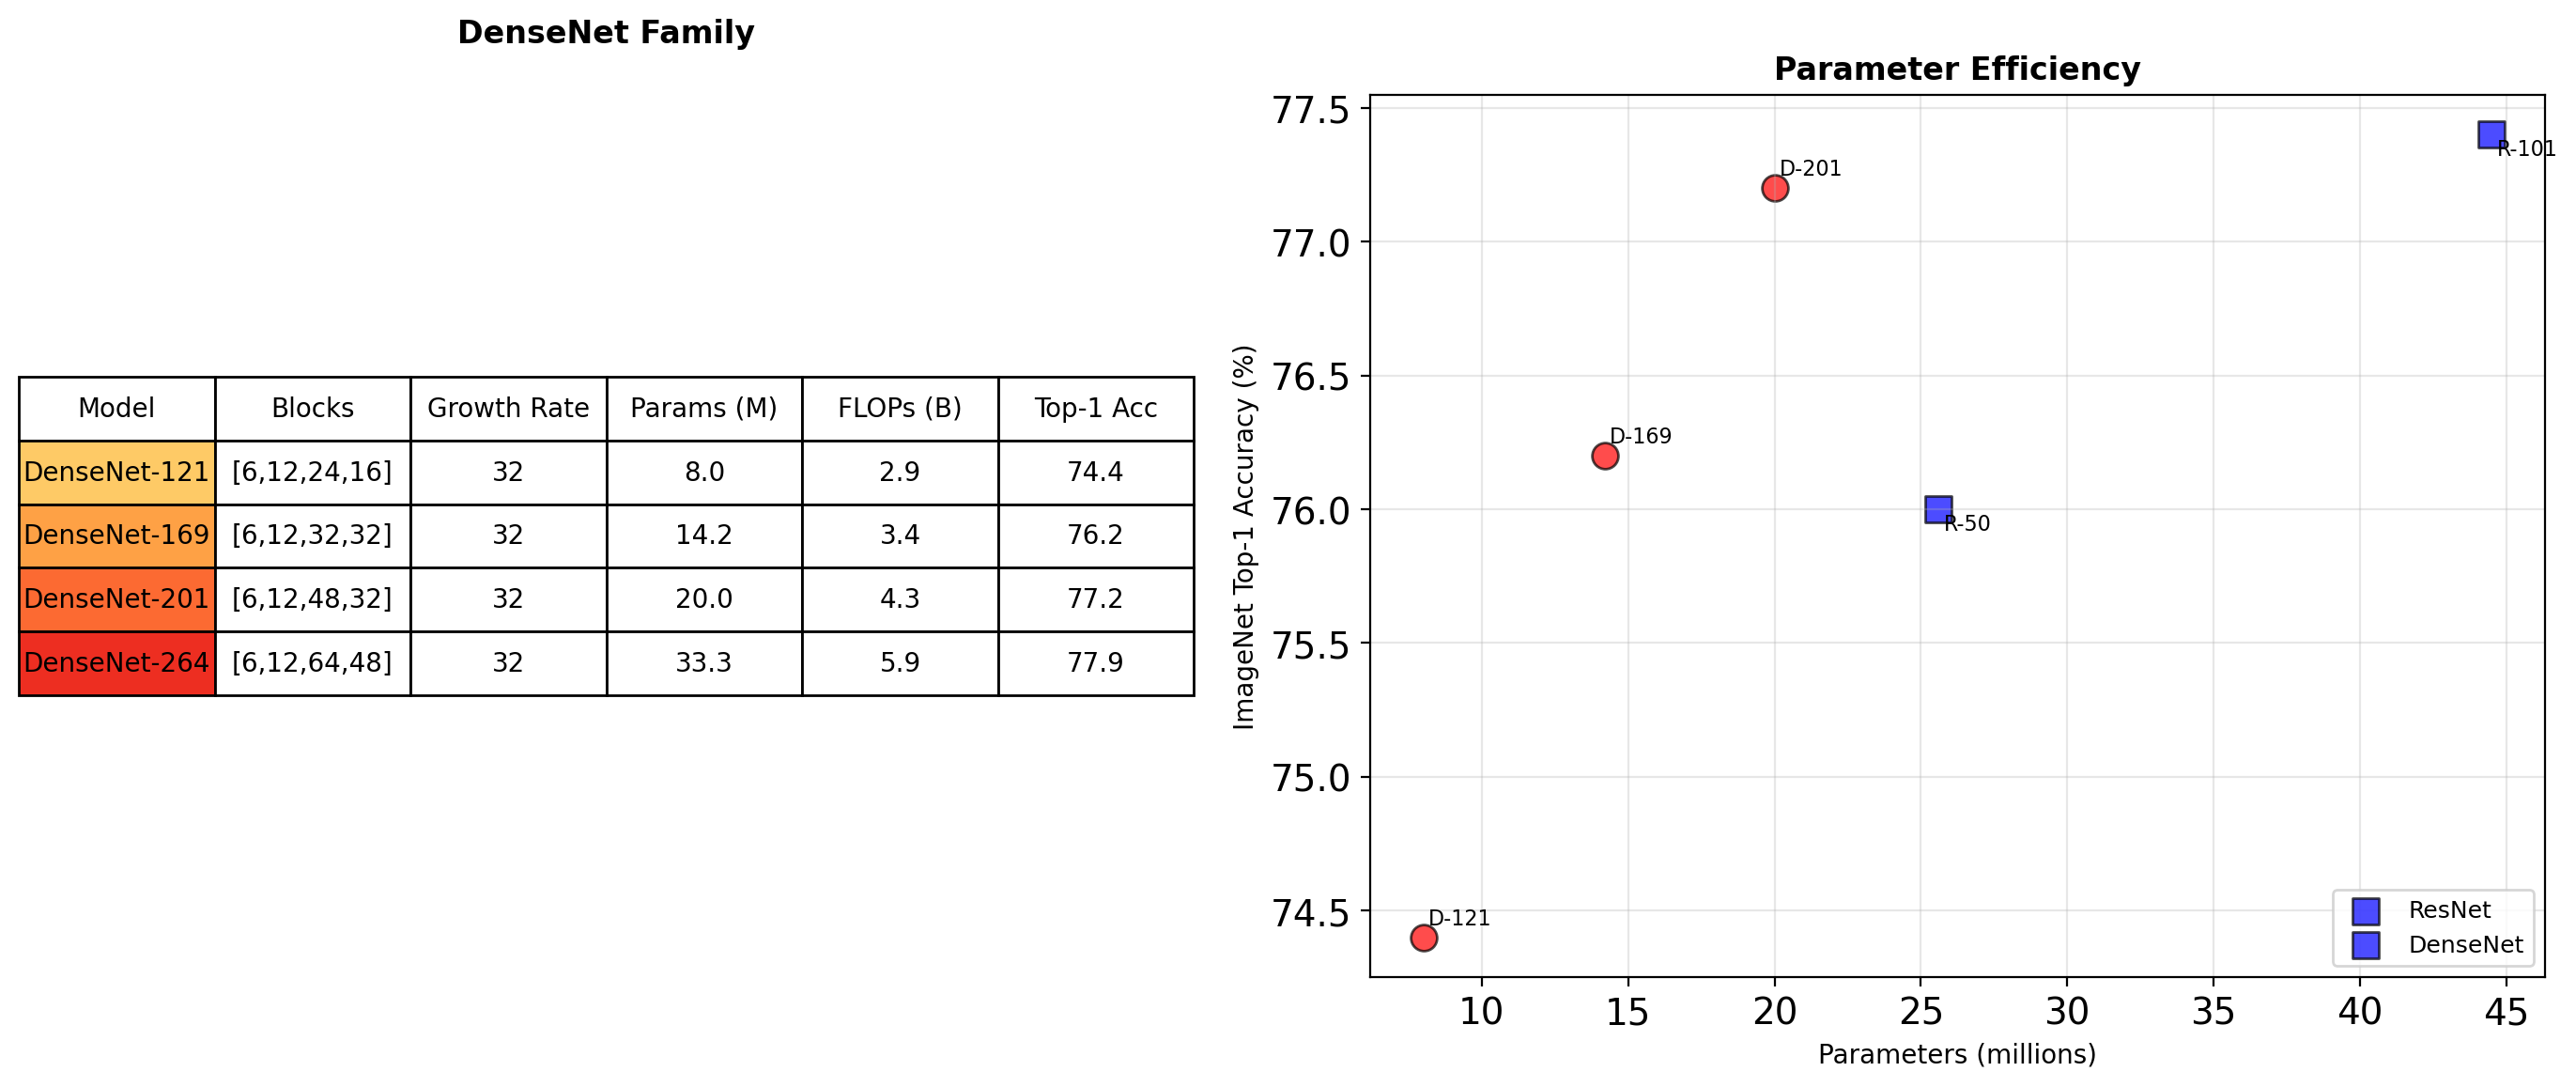
- Any classification backbone fits: ResNet, DenseNet, EfficientNet
Neck
- Reorganizes backbone features before prediction - FPN’s pyramid
- Optional: Faster R-CNN ran without one
Head
- Per-candidate prediction - the RPN plus the classification stage
- All task-specific prediction sits in the head
Single-shot detectors change the head, SSD changes the neck, Mask R-CNN adds a head.
Cascade and Deformable Convolution Extend Faster R-CNN
Cascade R-CNN - re-refine at rising thresholds
- Three detection stages trained at IoU 0.5, 0.6, 0.7
- Each stage refines the previous stage’s boxes at the quality it was trained for
- +3 AP over the Faster R-CNN baseline on COCO
Deformable convolution - learned sampling offsets
\[y(p) = \sum_{k=1}^{K} w_k \cdot x(p + p_k + \Delta p_k)\]
- The kernel’s sample points shift per position, following object shape
- +2 AP with deformable layers in the last backbone stage on COCO
Both keep the propose-then-classify decomposition.
Two-Stage Detection Runs at 5 FPS
Faster R-CNN takes 0.2 s per image.
Where the time goes
- Run the proposal stage, then evaluate the head on each of ~300 regions - pooling, classification, regression per region
- The per-region stage waits on the proposals - the two stages cannot overlap
What real time requires
- Video: 30 FPS, a 33 ms budget per frame
- Robotics and driving: tighter budgets on smaller hardware
Single-shot detectors drop the per-region stage and score every candidate inside the one backbone pass.
YOLO Predicts Every Box in One Pass
YOLO (2016): detection as one forward pass, one tensor out.
Divide the image into an \(S \times S\) grid (7×7 in v1)
Each grid cell:
- Predicts \(B\) bounding boxes with confidences
- Predicts \(C\) class probabilities, shared across its boxes
- Is responsible for an object if the object’s center falls inside it
Unified output tensor
\[S \times S \times (B \cdot 5 + C)\]
- Localization, objectness, and classification leave the network together
- Threshold the scores and apply NMS - detection is complete
YOLO Factors Detection into Conditional Probabilities
Each cell’s 30 values (\(B = 2\), \(C = 20\)) form a factored probability model.
Per box
- \((x, y)\) - center offset within the cell, \(\in [0, 1]\)
- \((w, h)\) - size as a fraction of the image
- Confidence - trained toward \(P(\text{object}) \times \text{IoU}\): how likely a box is real, and how well placed
Per cell, shared
- \(P(c_i \mid \text{object})\) - the class distribution, conditioned on an object being present
Detection score - multiply the factors
\[P(c_i \mid \text{box}_j) = \underbrace{P(c_i \mid \text{object})}_{\text{cell}} \times \underbrace{P(\text{object}) \times \text{IoU}}_{\text{box } j}\]
Sharing the conditional across boxes costs expressiveness - one class distribution per cell - and reduces the class outputs from \(B \cdot C\) to \(C\), trained only where objects exist.
Square Roots and Weights Rebalance the Loss
Each constant corrects a specific imbalance. Reason from the counts.
\(\sqrt{w}, \sqrt{h}\) - because absolute error is not what matters
- A 5 px miss ruins a 20 px box and is invisible on a 400 px one
- Regressing \(\sqrt{w}\) compresses large widths: equal error in \(\sqrt{w}\) tolerates more absolute error as boxes grow
\(\lambda_{\text{noobj}} = 0.5\) - because the grid is mostly empty
- 3 objects fill 3 of 49 cells - 46 cells train only “no object”
- Unweighted, the empty cells outvote the objects in the confidence gradient
\(\lambda_{\text{coord}} = 5\) - because localization is 4 numbers among 30
- The coordinate terms would fade against 20 class terms and the confidences
Constants tuned by hand, once, for one dataset. Cross-entropy and IoU-based losses replace the squared errors in the successors.
YOLO Changes Only the Head
Train in two resolutions
- Pretrain the first 20 conv layers on ImageNet at 224×224
- Add 4 conv and the 2 FC layers, then tune for detection at 448×448 - localization needs the finer detail classification never did
No neck, one scale
- The FC layers flatten the grid: global connectivity, spatial detail gone
- Everything predicts from one 7×7 map - the stride and receptive-field bounds, unaddressed
SSD Predicts from Six Feature Maps
SSD (2016) changes the neck: attach a prediction head to maps at six scales.
One map per object-size range
- conv4_3 at 38×38 - small objects
- conv7 through conv11_2: 19², 10², 5², 3², 1² - larger objects at each step
- A 3×3 conv head predicts classes and offsets at every position of every map
Reason from the stride
- A 38×38 map samples every 8 px - small boxes land on it
- The 1×1 map integrates the whole image - only the largest boxes fit
- The multi-scale answer to the stride and receptive-field bounds, built into the neck
Fully convolutional - no FC layers, any input size. 59 FPS at 300×300, above YOLO’s accuracy on VOC.
SSD Extends VGG with Shrinking Feature Maps
- Six tap points, a 3×3 conv head per map - per-map weights: channel count and k differ across taps
- The added layers replace VGG’s FC layers - the whole network stays convolutional
Default Boxes Are Anchors per Feature Map
SSD’s references - the anchors of the region-based section, one set per map.
Set the scale from the map index
\[s_k = s_{\min} + \frac{s_{\max} - s_{\min}}{m - 1}(k - 1)\]
- \(s_{\min} = 0.2\) to \(s_{\max} = 0.9\) of the image across the \(m\) maps
Fan out the shapes
- Ratios \(a_r \in \{1, 2, 3, 1/2, 1/3\}\): width \(s_k\sqrt{a_r}\), height \(s_k/\sqrt{a_r}\) - equal area, different shape
Count them
- \(38^2{\cdot}4 + 19^2{\cdot}6 + 10^2{\cdot}6 + 5^2{\cdot}6 + 3^2{\cdot}4 + 1{\cdot}4 = 8{,}732\) per image
- Offsets use the anchor parameterization unchanged
Each Ground Truth Trains Its Matched Boxes
Question: 8,732 fixed boxes, a handful of objects - which boxes carry each object’s training signal?
Guarantee every object a signal
- Match each ground truth to its highest-IoU default box - even a badly covered object trains something
Use the near misses
- Also match every default box above IoU 0.5 - close boxes are good regression material, and one object may train several
Discard the easy background
- The unmatched ~8,700 would bury 10 positives
- Sort negatives by confidence loss and keep the top 3:1 against positives - train on the background the network currently gets most wrong, skip what it already scores correctly
SSD Trains with the Standard Two-Term Loss
\[L(x, c, l, g) = \frac{1}{N}\left(L_{\text{conf}}(x, c) + \alpha\, L_{\text{loc}}(x, l, g)\right)\]
Why each choice
- \(L_{\text{conf}}\) - softmax cross-entropy: the matched loss for probabilities that YOLO’s squared error was not
- \(L_{\text{loc}}\) - smooth L1 on anchor offsets, matched boxes only
- \(\frac{1}{N}\) - divide by matched count: an image with 30 objects should not carry 10× the gradient of an image with 3
- \(\alpha = 1\) - both terms already average over the same \(N\) positives, so no hand weight is needed - the balance YOLO required \(\lambda_{\text{coord}} = 5\) to impose
Assignment by IoU, mined negatives, cross-entropy, smooth L1 - the general form with every choice filled in.
RetinaNet: Easy Negatives Dominate the Dense Loss
RetinaNet’s starting point: dense detectors score ~100k anchors per image, and mining is not the only answer.
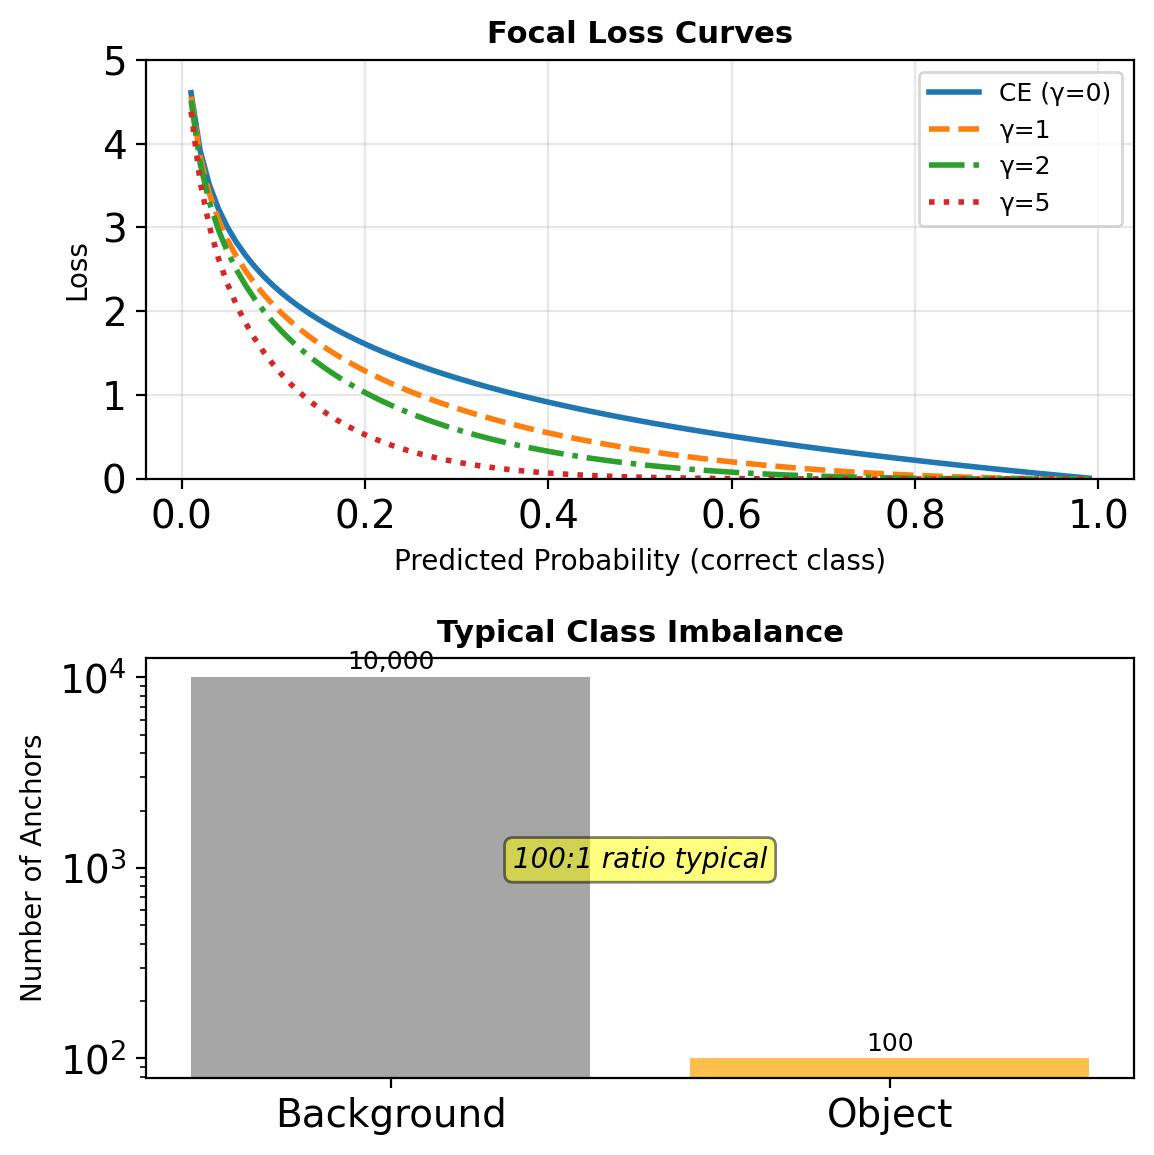
Count the loss mass
- Under 100 anchors are positive - the rest is background, mostly easy: sky, road, texture
- An easy negative at \(p = 0.9\) contributes \(-\log(0.9) = 0.105\)
- 100,000 of them contribute ~10,500
- 100 positives at \(p = 0.1\) contribute \(-\log(0.1) \times 100 = 230\)
The background term outweighs the foreground ~45×. Train on everything and the gradient follows the background.
Focal Loss Down-Weights Easy Examples
Start from cross-entropy, multiply in a modulating factor:
\[\text{CE}(p_t) = -\log(p_t) \qquad \text{FL}(p_t) = \underbrace{(1 - p_t)^\gamma}_{\text{modulating factor}}\, \underbrace{\left(-\alpha_t \log(p_t)\right)}_{\text{weighted CE}}\]
The factor, at \(\gamma = 2\)
- \(p_t = 0.9\): ×0.01 - easy examples 100× down
- \(p_t = 0.1\): ×0.81 - hard examples nearly untouched
- \(\gamma = 0\): cross-entropy exactly
The gradient vanishes with confidence
\[\frac{\partial\,\text{FL}}{\partial p_t} = \alpha_t\,\frac{(1-p_t)^{\gamma-1}}{p_t}\left(\gamma\, p_t \ln p_t - (1-p_t)\right)\]
- \(p_t \to 1\): the gradient goes to zero - easy examples stop updating the network
- Cross-entropy’s gradient stays at \(-\alpha_t\) as \(p_t \to 1\) - easy examples keep pushing
In use
- \(\alpha_t = 0.25\) - class-prior weight
- Every anchor trains: selection by weight, not by sampling
- RetinaNet: first single-shot detector past two-stage accuracy on COCO
IoU Losses Optimize the Evaluation Metric
YOLO’s loss minimizes coordinate error, but evaluation measures IoU.
Regress the metric
\[L_{\text{IoU}} = 1 - \text{IoU}(b, \hat{b})\]
- Scale-invariant by construction - the square-root repair becomes unnecessary
- Zero gradient once boxes are disjoint - the IoU property from the problem formulations
Restore the gradient
- GIoU - subtract a penalty from the smallest enclosing box: distance produces gradient even for disjoint boxes
- CIoU - add center distance and aspect-ratio terms
- Standard in the modern YOLO family
CenterNet Detects Centers as Keypoints
Anchor-free detection, built from the pose-estimation pipeline: treat an object as a point.
Predict a center heatmap
- One heatmap per class, Gaussian targets at object centers - exactly the keypoint construction from pose estimation
- Regress size and sub-pixel offset at each center - the map proposes, regression refines
What disappears
- Anchors: no scales, ratios, or assignment thresholds to tune
- NMS: keep a center if it is the local maximum in its 3×3 neighborhood
What returns
- The heatmap costs: output stride, sub-pixel offsets, no gradient through peak extraction
YOLOv2 Adopts Anchors and Drops the FC Head
YOLOv2 (2017) rebuilds YOLO one change at a time and measures each on VOC - an ablation study:
| Change | Measured effect |
|---|---|
| Batch normalization | ~+2 mAP |
| Higher-resolution pretraining | ~+4 mAP |
| Anchor boxes replace the FC head | recall 81% → 88% |
| Clustered anchor shapes | better priors at equal count |
| Multi-scale training | one model, many input sizes |
Head redesign
- Drop the FC layers: convolution to the end, spatial structure kept
- 5 clustered anchors per cell, offsets in place of raw boxes
- Classes move per anchor - each anchor gets its own conditional distribution, where v1 shared one per cell
YOLOv3 adds prediction at three scales with an FPN-style neck.
The two detector families now share anchors, offsets, and IoU-based losses - they differ in candidate source, assignment rules, and operating point.
The Families Now Overlap in Accuracy
COCO test-dev, values as published, conditions attached:
| Detector | Backbone | mAP | Params | Reported time |
|---|---|---|---|---|
| SSD512 | VGG-16 | 28.8 | 36M | - |
| YOLOv3 | Darknet-53 | 33.0 | 62M | 51 ms, Titan X |
| Faster R-CNN + FPN | R-101 | 36.2 | 60M | - |
| RetinaNet | R-101-FPN | 39.1 | 57M | - |
| YOLOv8 (n → x) | scaled | 37.3-53.9 | 3M-68M | - |
- With focal loss, single-shot mAP surpassed two-stage. The modern YOLO family exceeds both
- One architecture, five sizes: YOLOv8 spans 3M to 68M parameters as one scaling family
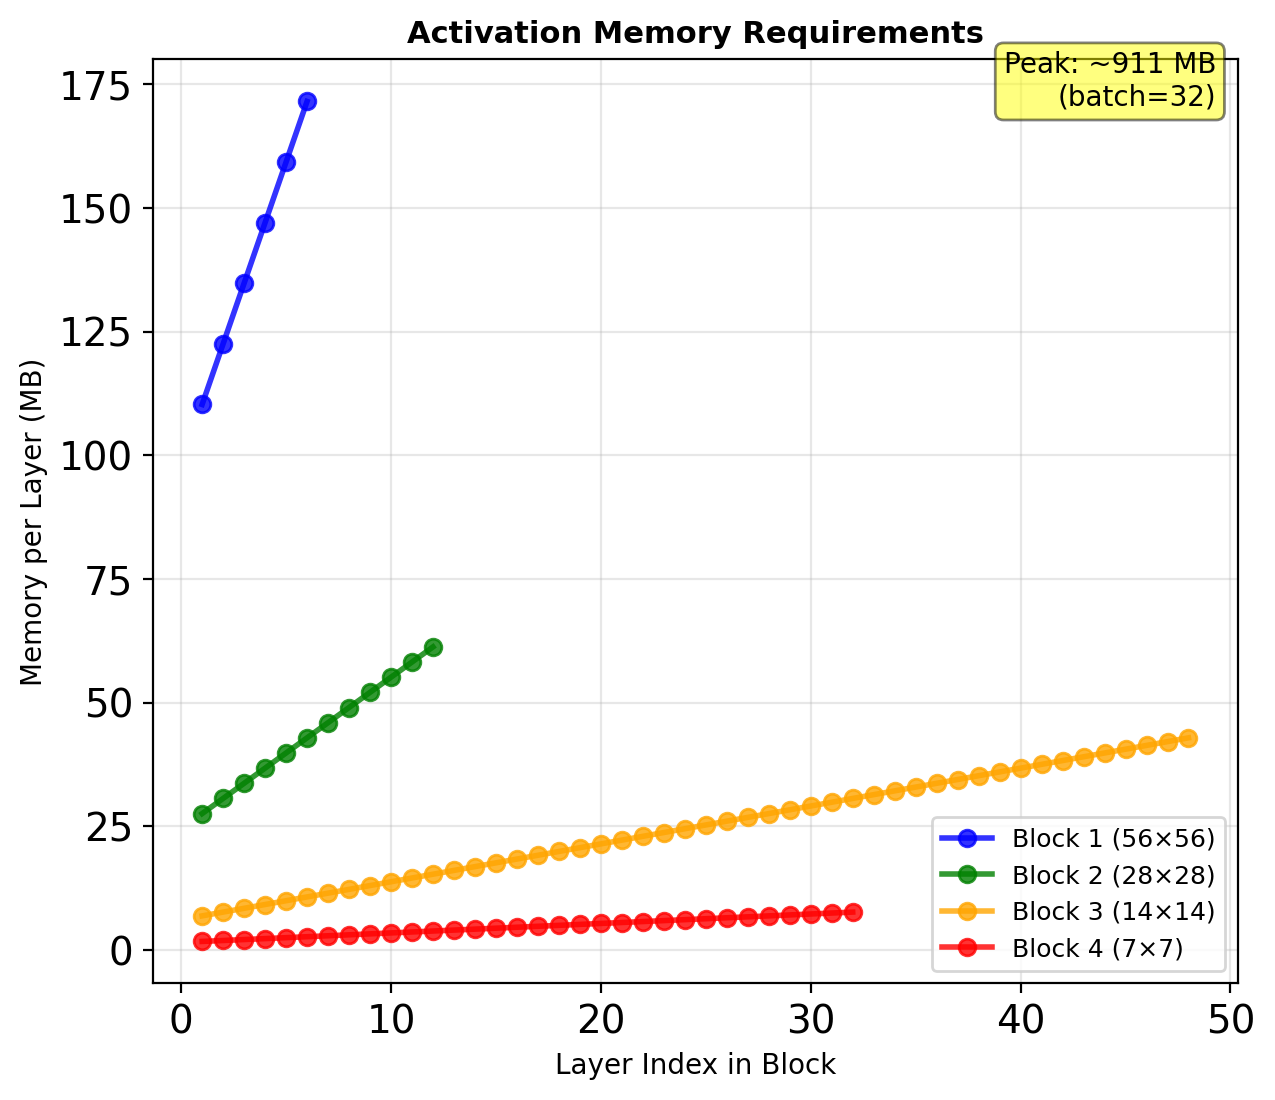
- Inference memory follows the parameter count. Training memory follows resolution and batch - backbone activations dominate for every family.
Comparisons hold only at stated dataset, input size, backbone, and hardware.
Failure Concentrates in Small and Crowded Objects
Small objects
- RetinaNet, COCO: AP\(_S\) 24.1 against AP\(_L\) 51.2 - half the accuracy or less, every family
- The stride and receptive-field bounds from the problem formulations - pyramids narrowed the gap, none closed it
Crowded scenes
- NMS cannot separate two true objects that overlap above its threshold - one suppresses the other
- The failure sits in the filtering step, after the network is already correct
Occlusion
- A partially visible object offers partial evidence at every candidate - assignment, scoring, and boxes all degrade together
DETR predicts the detection set directly - Hungarian matching in place of assignment, no anchors, no NMS - developed with the transformer architectures.
Segmentation Makes a Prediction per Pixel
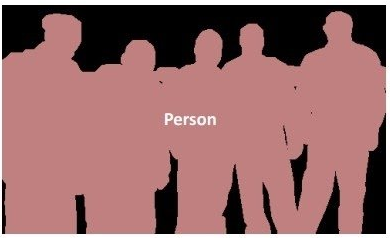
Semantic - a class per pixel:
\[f: \mathbb{R}^{H \times W \times 3} \rightarrow \{1, ..., C\}^{H \times W}\]
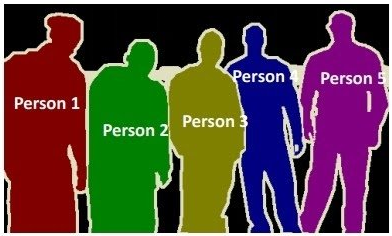
Instance - a mask per object:
\[f: \mathbb{R}^{H \times W \times 3} \rightarrow \left(\{0,1\}^{H \times W}\right)^N\]
Predictions per image
- Classification: 1
- Detection: ~10²
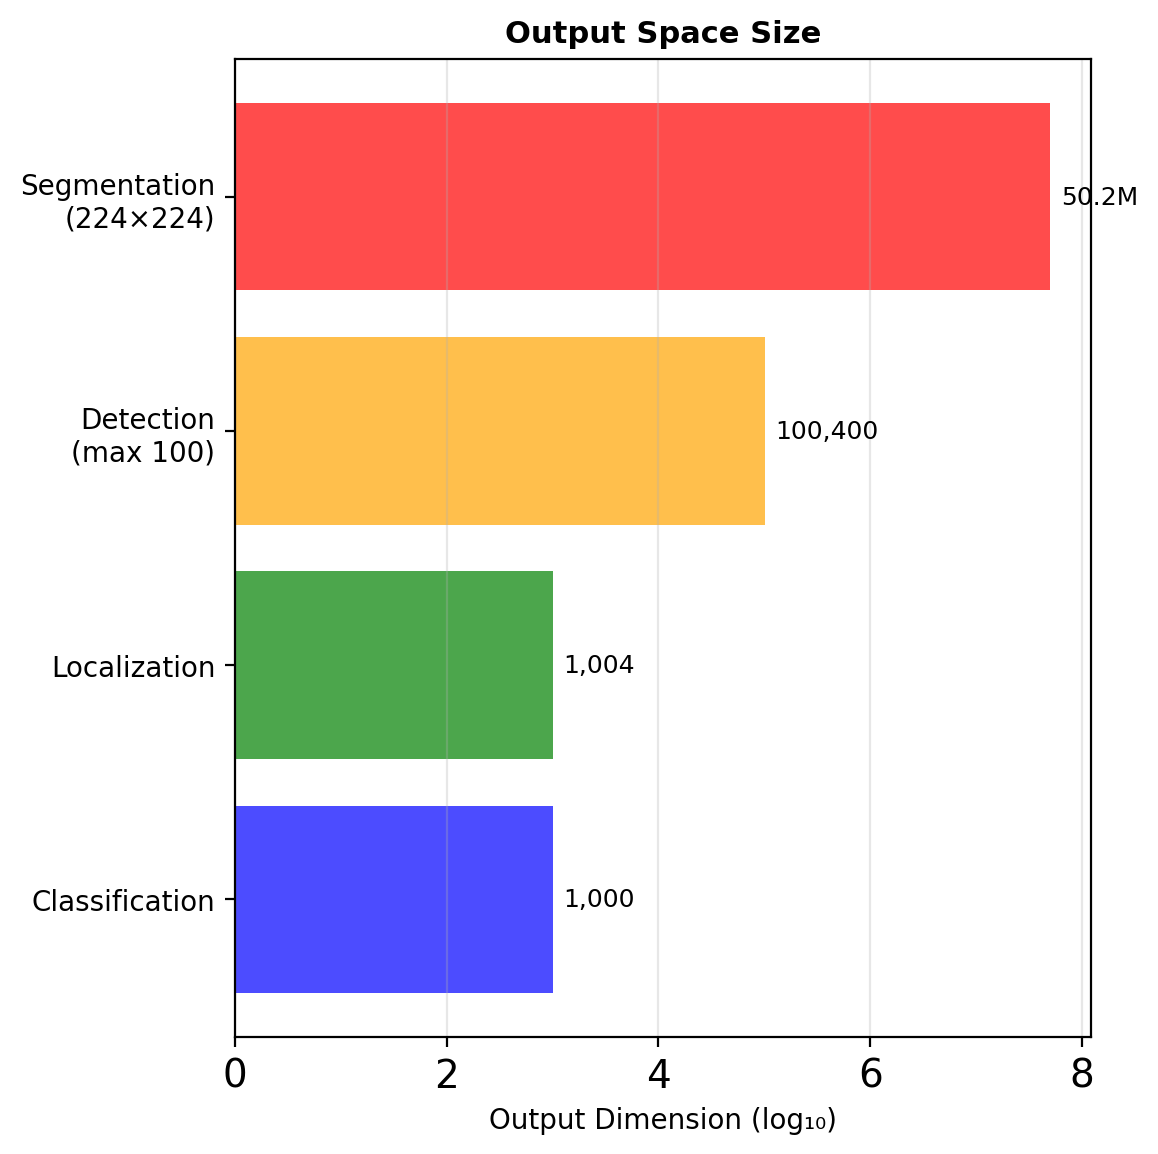
- Segmentation: \(H \times W\) - 262,144 at 512×512
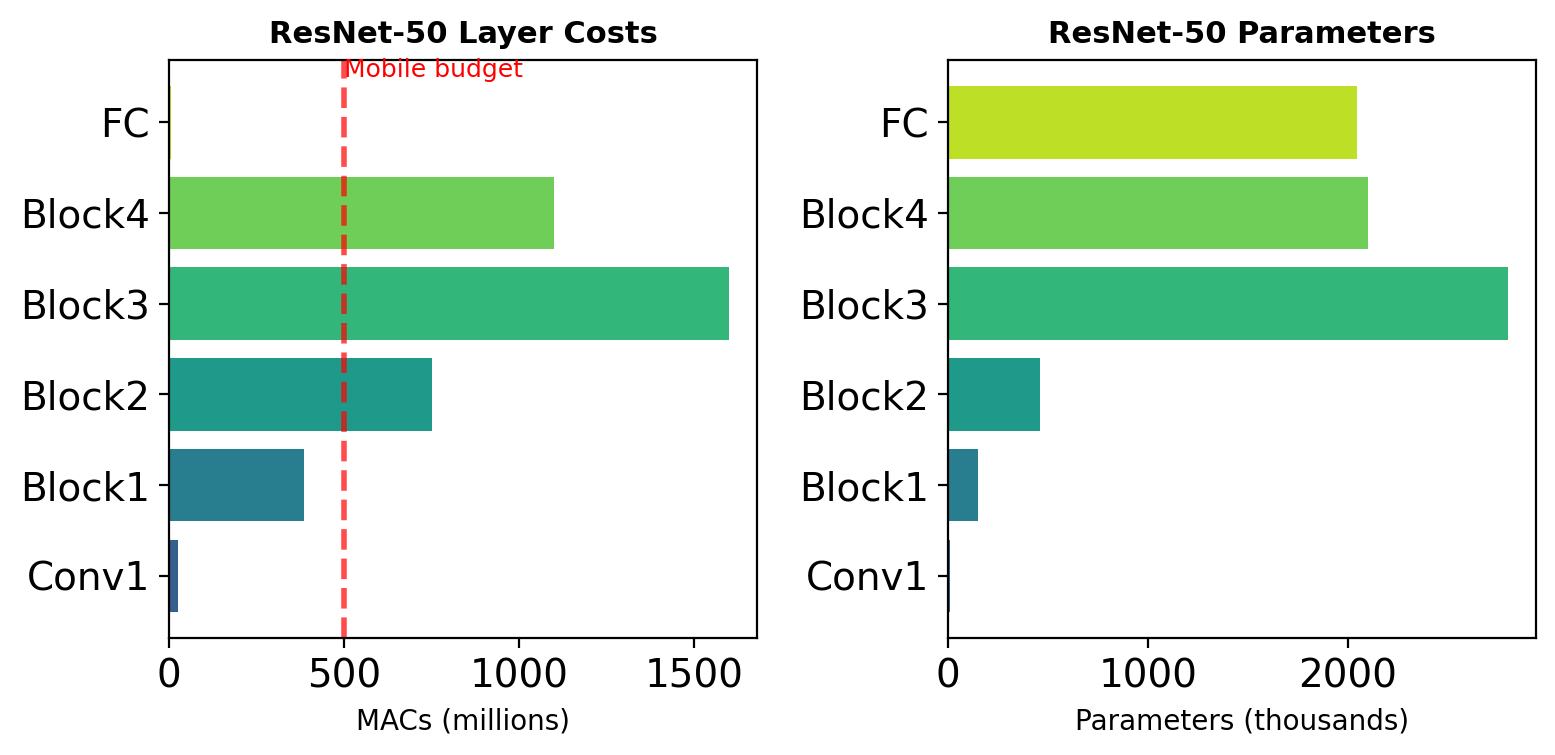
Keeping Full Resolution Costs 1,000×
Backbone resolutions (ResNet-50, 224² input)
- Stage 1: 112×112
- Stage 2: 56×56
- Stage 3: 28×28
- Stage 4: 14×14
- Stage 5: 7×7 - stride 32
Cost of not downsampling
- Conv compute and activation memory scale with \(H \times W\)
- Stage 5 at full resolution: \(224^2 / 7^2 = 1024\times\) its current cost
- Receptive field needs the stride - each downsample doubles its growth
Both directions lose
- Downsample: spatial detail gone
- Keep resolution: compute and memory explode
Segmentation needs deep context and fine resolution at once.
Fully Convolutional Networks Accept Any Input Size
The fully convolutional network (FCN): convert the classifier’s head so one pass predicts at every position.
Conversion
- FC on a 7×7×512 map, 4,096 outputs: weights 7×7×512×4096
- Reshape the same weights: one 7×7 convolution, 4,096 filters
- Identical output at the training size
Consequences
- Larger input, larger output: a class map instead of a class
- Pretrained classifier weights carry over unchanged
- Output at stride 32 - upsampling, skip connections, and dilation recover the resolution
Transposed Convolution Upsamples with Learned Weights
Bilinear interpolation
- Fixed weights from fractional positions
- No parameters, smooth by construction
Transposed convolution
- Insert \(s{-}1\) zeros between inputs, then convolve
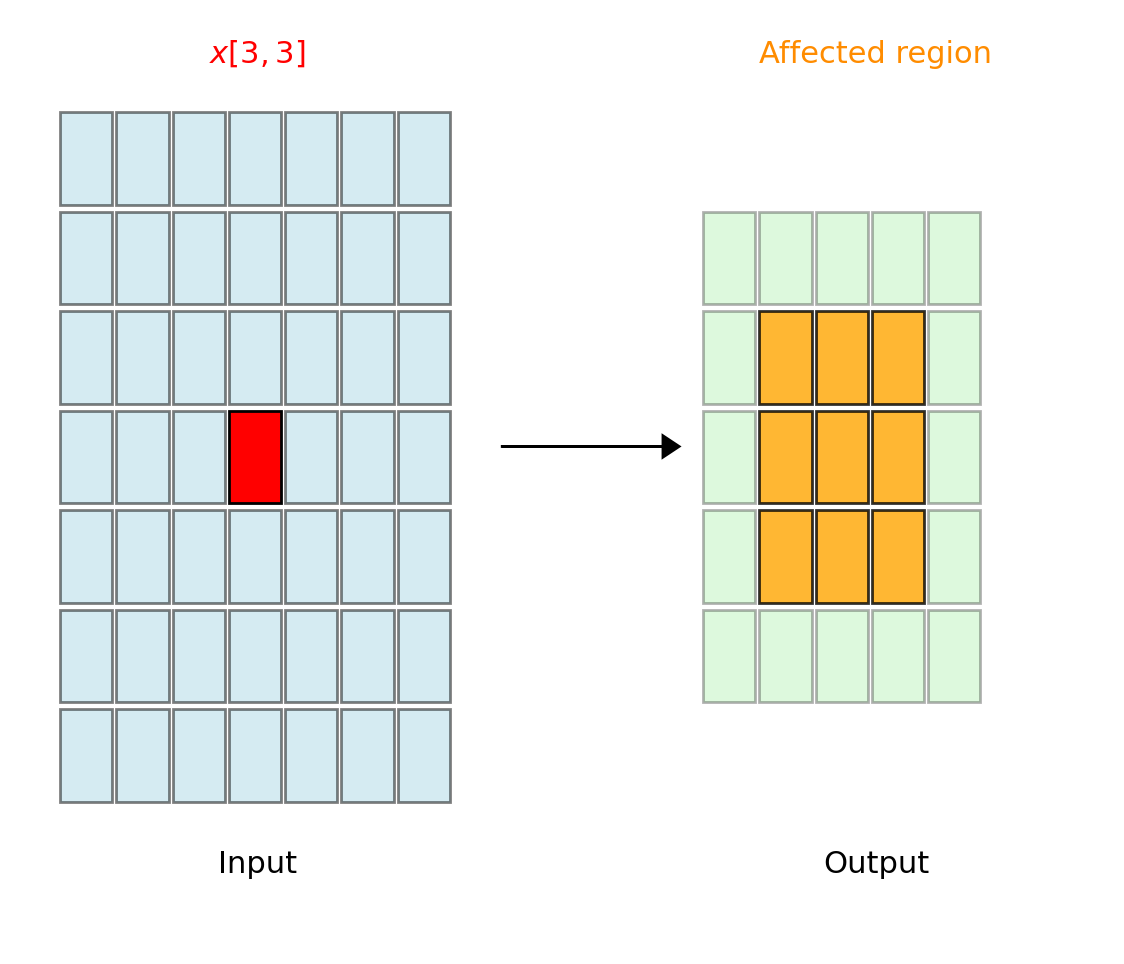
- The backward pass of a strided convolution from CNN gradients, run forward
- Learned weights - the upsampling trains with the rest of the network
Checkerboard artifacts
- Uneven kernel overlap whenever the stride does not divide the kernel size
- \(k=3, s=2\): coverage alternates 1-2-1-2
- \(k=4, s=2\): uniform
- Repairs: even kernels, or bilinear-then-convolve
Skip Connections Recover Spatial Detail
FCN’s ablation: fuse finer layers into the prediction before the final upsample.
Variants
- FCN-32s: upsample the stride-32 map directly
- FCN-16s: add pool4, upsample 16×
- FCN-8s: add pool4 and pool3, upsample 8×
| Variant | VOC mIoU |
|---|---|
| FCN-32s | 59.4 |
| FCN-16s | 62.4 |
| FCN-8s | 62.7 |
Fusion is in score space
- Taps differ in depth (256, 512, 4096 channels) - a fresh 1×1 conv scores each to 21
- The add merges 21-channel score maps, upsampled 2× to matched stride - class votes, not features
Shape of the gains
- Each fused layer restores detail lost to its stride
- Returns diminish by pool3 - the earliest layers carry too little class information
U-Net Concatenates the Encoder into the Decoder
The encoder-decoder from pose estimation, with a change at the skips.
Contracting path
- Paired 3×3 convolutions
- 2×2 max pool
- Channels double per level
Expanding path
- 2×2 up-convolution halves channels (1024 → 512)
- Concat restores them (+512 skip = 1024), the paired convolutions halve again (→ 512)
Concatenate at the skips
- FCN adds - the two signals share channels
- U-Net concatenates - detail and context stay separate channels
- The following convolutions weight them freely
~31M parameters at 64 initial filters. The default where training sets are small.
Dilation Widens Receptive Fields Without Downsampling
Downsampling grew the receptive field and lost resolution. Dilation grows the field with resolution kept.
Atrous convolution, rate \(r\)
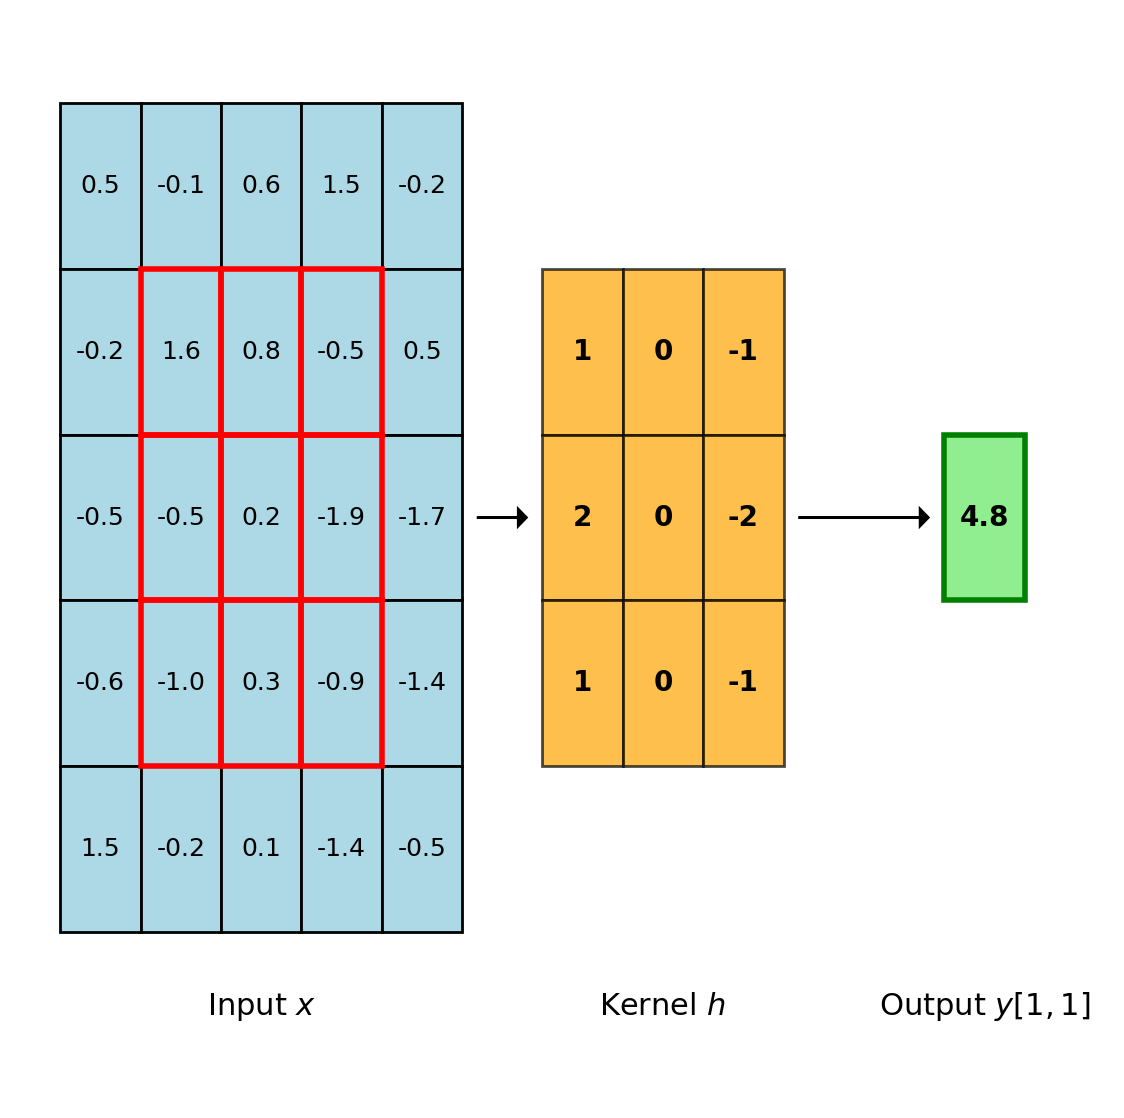
\[y[i,j] = \sum_{m,n} h[m,n] \cdot x[i + rm,\, j + rn]\]
- Taps spaced \(r\) apart
- Effective extent: \(r(K-1)+1\)
- Parameters: still \(K^2\)
In a segmentation backbone
- Replace the last strided layers with dilated ones
- Output stride stops at 8 or 16 instead of 32
- Cost: those layers run at 4× the positions
Atrous Spatial Pyramid Pooling Mixes Context Sizes
Atrous spatial pyramid pooling (ASPP): one rate sees one context size, so run several in parallel.
Branches over one map
- 1×1 convolution
- 3×3, rate 6
- 3×3, rate 12
- 3×3, rate 18
- Global average pool → 1×1 → upsample
Concatenate all five, fuse with a 1×1 convolution.
Against the detector necks
- SSD: scales from different maps
- FPN: scales from different levels
- ASPP: scales from one map, different rates - resolution kept
Conditional Random Fields Sharpen Object Boundaries
Upsampled predictions blur object boundaries. The conditional random field (CRF) refines the labels using the image itself.
Energy over a labeling \(x\)
\[E(x) = \sum_i \psi_u(x_i) + \sum_{i,j} \psi_p(x_i, x_j)\]
At pixel \(i\): label \(x_i\), position \(p_i\), color \(I_i\)
Unary - the network’s per-pixel scores
\[\psi_u(x_i) = -\log P(x_i)\]
Pairwise - penalize disagreement between similar pixels
- Color similarity: \(\exp\!\left(-\frac{|I_i - I_j|^2}{2\sigma_\beta^2}\right)\)
- Spatial proximity: \(\exp\!\left(-\frac{|p_i - p_j|^2}{2\sigma_\alpha^2}\right)\)
Mean-field inference
- Each pixel updates its label distribution against all others, weighted by the kernels
- 5-10 rounds, fast Gaussian filtering
Measured effect
- DeepLab v1: ~+4 mIoU on VOC
- DeepLab v3 drops it - stronger backbones sharpen enough alone
Energy minimization over labelings returns with energy-based generative models.
Mask R-CNN Adds a Mask Head to Faster R-CNN
Reuse the detection stack
- Backbone + FPN, the RPN’s proposals, Fast R-CNN’s class and box heads - all unchanged
- New: a per-region mask branch, \(14 \times 14 \times 256\) through convolutions to \(28 \times 28 \times C\)
\[\mathcal{L} = \mathcal{L}_{cls} + \mathcal{L}_{box} + \mathcal{L}_{mask}\]
Decoupled classes
- Binary cross-entropy on the ground-truth class channel only
- Mask shapes never compete across classes - classification stays the class head’s job
The pooling cannot be reused
- A 28×28 mask maps back to pixels through the region’s coordinates
- RoI pooling rounds those coordinates - up to 8 px of shift at stride 16
- Mask R-CNN replaces the pooling with RoIAlign
RoIAlign Samples Features at Exact Positions
The two poolings, step for step:
| RoI pooling | RoIAlign | |
|---|---|---|
| Region boundary | floor to cells | kept fractional |
| Bin boundaries | floor to cells | kept fractional |
| Bin value | max over cells | bilinear samples, averaged |
| Error | up to 8 px at stride 16 | none |
| Gradient | through the max cell | through exact positions |
Measured on masks
- Mask AP: 30.9 → 33.9 from alignment alone
- Box AP: little change - boxes never needed sub-cell precision
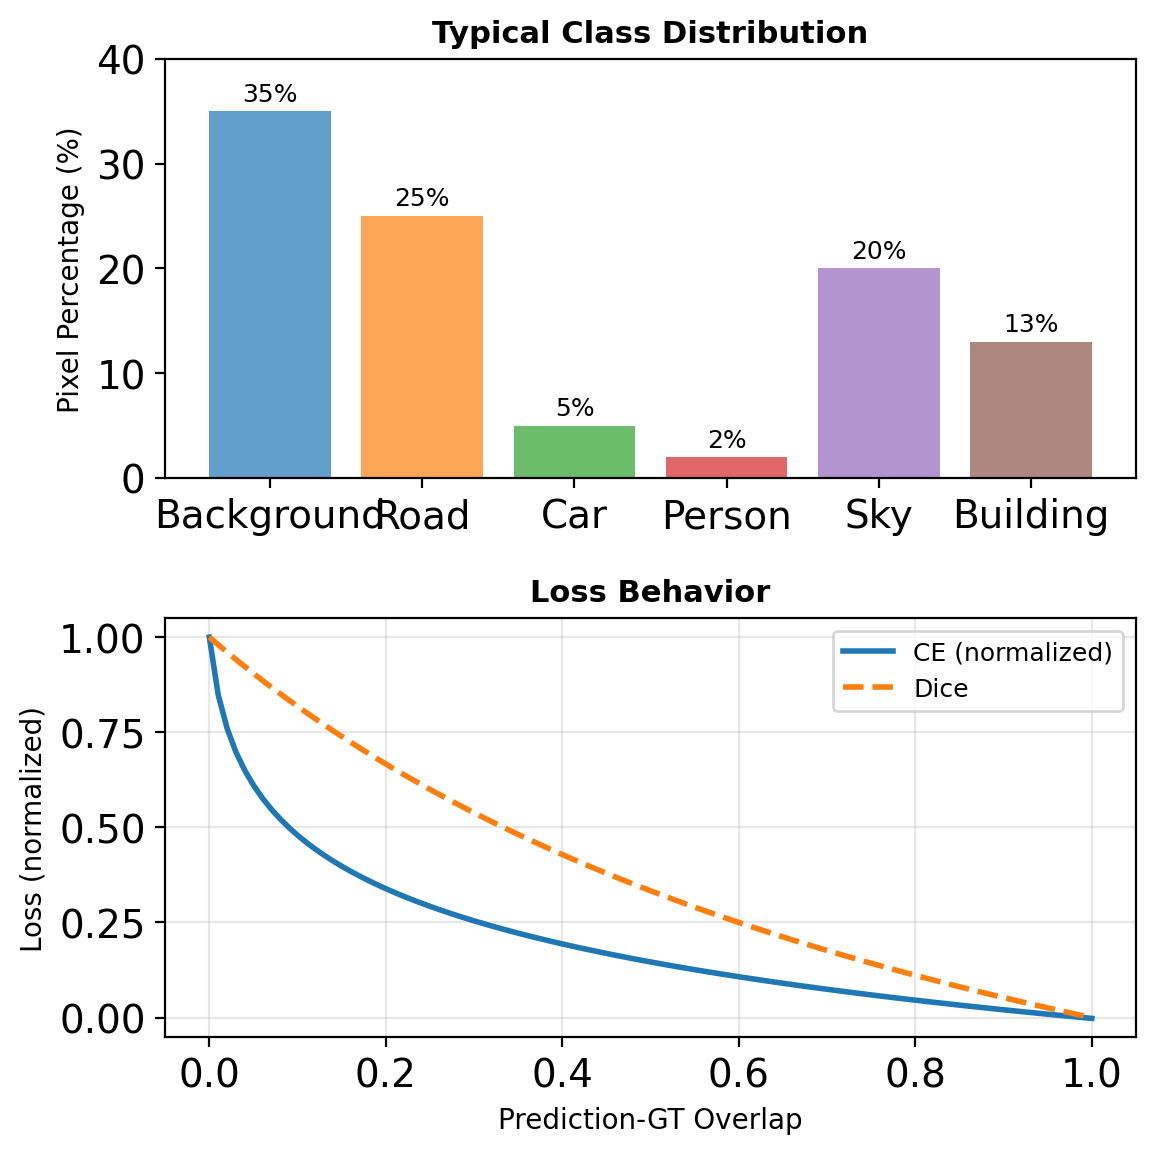
Dice Loss Scores the Mask as a Whole
Dice - the region-ratio loss
\[\mathcal{L}_{Dice} = 1 - \frac{2\sum_{ij} y_{ij}\hat{y}_{ij} + \epsilon}{\sum_{ij} y_{ij} + \sum_{ij} \hat{y}_{ij} + \epsilon}\]
- The mask analog of the IoU box losses from single-shot detection
- True negatives appear in neither sum - background enters only as false-positive mass, never as a count
- Object size cancels - an \(N\)-pixel object at overlap fraction \(q\):
\[\text{Dice} = \frac{2qN}{2qN + 2(1-q)N} = q\]
- \(\epsilon\) keeps empty masks defined
- Standard where foreground is rare: medical and defect segmentation
Panoptic Segmentation Labels Stuff and Things
Two label families
- Stuff: sky, road - class only
- Things: cars, people - class and identity
Panoptic output
- Every pixel: a class
- Every thing pixel: an instance identity
- Semantic and instance segmentation under one consistent labeling
Panoptic quality
\[PQ = \underbrace{\frac{\sum_{(p,g) \in TP} \text{IoU}(p,g)}{|TP|}}_{\text{segmentation quality}} \times \underbrace{\frac{|TP|}{|TP| + \tfrac{1}{2}|FP| + \tfrac{1}{2}|FN|}}_{\text{recognition quality}}\]
- Mask overlap and detection scored as separable factors
Panoptic FPN
- One backbone, one FPN neck
- Mask R-CNN heads for things
- A parallel semantic head for stuff
The backbone-neck-head decomposition again: two head groups, one backbone-neck pair.
Efficient Designs Split Spatial and Context Paths
Driving and mobile deployments need segmentation at video rate.
BiSeNet - two parallel paths
- Spatial path: shallow, stride 8 - detail
- Context path: deep, stride 32 - class evidence
- Fusion module joins them - detail and context computed in parallel rather than through an encoder-decoder
ENet - shrink early
- Aggressive downsampling in block one
- Asymmetric 1×n and n×1 convolutions
- 0.4M parameters
| Model | Cityscapes mIoU | FPS | Params |
|---|---|---|---|
| BiSeNet | 68.4 | 65 | 13M |
| ENet | 58.3 | 135 | 0.4M |
Failure Concentrates at Boundaries and Thin Structures
Boundaries
- Downsampled features average across edges
- Prediction confidence is lowest exactly where labels change
- Boundary pixels are few - mIoU barely registers the blur
Thin structures
- A pole or lane marking narrower than the stride vanishes in the encoder
- Objects below the stride fall between cells (problem formulations) - here that is a structure, not a small object
- Skips, dilation, and high-resolution paths reduce the loss - none remove it
Metrics hide both
- A 2 px boundary error on every object costs a fraction of an mIoU point and corrupts downstream geometry
Segment Anything Produces a Mask per Prompt
An instance mask costs ~79 s of annotation (problem formulations).
Segment Anything Model (SAM), 2023
- Input: a point, box, or coarse mask
- Output: a mask for the indicated object
- No per-task training - zero-shot to unseen domains
Training data
- SA-1B: 11M images, 1.1B masks
- Bootstrapped - the model annotates, humans correct
Cost per mask
- ~79 s of human time → one click
- Dense labeling stops limiting dataset size
HRNet avoids the recovery problem instead: parallel streams keep full resolution throughout. Transformer-based models, SAM included, are developed with the transformer architectures.
3D Data Has No Canonical Grid
An image is an array. 3D data comes in three forms, none of them an array:
Voxels - a regular 3D grid
- 3D convolution applies directly
- Memory grows with the cube of resolution
- Mostly empty space
Point clouds - unordered sets
- Compact: only occupied space stored
- No neighborhood structure, no order
- What LiDAR and depth sensors produce
Meshes - vertices and faces
- Compact surfaces with connectivity
- Irregular graphs - convolution needs redefining
The representation determines the architecture - each of the three gets its own.
Voxel Grids Cost Memory Cubed
3D convolution
\[y[d,i,j] = \sum_{c} \sum_{k,m,n} w[k,m,n,c] \cdot x[d{+}k,\, i{+}m,\, j{+}n,\, c]\]
- Complexity: \(O(K^3 \cdot C_{in} \cdot C_{out} \cdot D \cdot H \cdot W)\)
- One more spatial factor than 2D - resolution is paid for three times
- The drop-in analog of
nn.Conv2d- one added depth axis in weights and activations
Occupancy
- A surface fills \(O(N^2)\) of the \(O(N^3)\) grid
- Occupied fraction falls as resolution grows - under 5% at useful sizes
Sparse convolutions
- Compute only at occupied voxels
- Submanifold sparse convolution: outputs stay on the input’s occupancy
A Point Cloud Is an Unordered Set
\[\mathcal{P} = \{p_i\}_{i=1}^{N}, \quad p_i \in \mathbb{R}^3\]
Requirement
- The sensor returns points in arbitrary order
- The network must give one answer per cloud:
\[f(\{p_1, ..., p_N\}) = f(\pi\{p_1, ..., p_N\}) \;\; \forall \pi\]
Why an ordinary network fails
- Concatenate the points into a vector and each weight binds to a position in the ordering
- Reorder the same cloud and the output changes
The set problem from the problem formulations, on the input side this time - detection produced sets, point networks consume them.
PointNet Builds Invariance from a Symmetric Function
\[f(\{p_1, ..., p_N\}) = \gamma\!\left(\max_{i=1..N} h(p_i)\right)\]
Three parts
- \(h\) - one MLP applied to every point, shared weights: \(\mathbb{R}^3 \rightarrow \mathbb{R}^{1024}\)
- \(\max\) - element-wise over points: symmetric, so order cannot matter
- \(\gamma\) - an MLP on the pooled global feature
Why this form suffices
- Any symmetric aggregation gives invariance - max, sum, mean
- The paper’s result: with enough feature dimensions, this form approximates any continuous set function
T-Net - learned alignment
- Small networks predict 3×3 and 64×64 transforms applied to points and features
- Regularized toward orthogonality: \(\|I - AA^T\|^2\)
Max Pooling Keeps Only Critical Points
Each of the 1,024 feature dimensions keeps one point’s value - the maximum. Everything else vanishes from the global feature.
Consequences, both directions
- Robustness: dropping non-critical points changes nothing - the feature survives missing and noisy points
- At most 1,024 points determine the output, however large the cloud
The cost
- No local structure: two nearby points interact only through the global max
- Fine surface detail is invisible. PointNet++ adds local structure to recover it
PointNet++ Applies PointNet to Local Neighborhoods
The CNN stage pattern, rebuilt for sets: local features, then coarser resolution, repeated.
Set abstraction, one stage
- Sample centers - farthest point sampling spreads them over the cloud
- Group - collect each center’s neighbors inside a radius
- Encode - a small PointNet per group: one feature vector per center
Stack the stages
- Each stage: fewer points, larger neighborhoods, richer features
- The resolution-for-depth trade of CNN backbones, without a grid
Density varies
- LiDAR clouds thin with distance - grouping at several radii per stage compensates
PointPillars Collapses Height into Channels
3D detection without 3D convolution.
The two predecessors
- VoxelNet: PointNet per voxel, then 3D convolution - 4 FPS
- SECOND: sparse 3D convolution - 20 FPS
The pillar pipeline
- Grid the ground plane only - each cell is a full-height pillar
- Small PointNet per pillar - one feature vector per cell
- The result is a 2D feature map: a bird’s-eye pseudo-image
Then everything transfers
- A 2D backbone, neck, and detection head run unchanged on the pseudo-image
- 62 FPS - the speed of 2D detection, on LiDAR
- KITTI car AP (moderate): 82.6 against SECOND’s 83.1 and VoxelNet’s 77.5
Rendered Views Beat Native 3D on ModelNet40
Multi-view classification
- Render the object from a ring of viewpoints
- One shared 2D CNN per view - ImageNet-pretrained
- Pool the view features, classify
| Representation | ModelNet40 accuracy |
|---|---|
| Multi-view CNN | 90.1% |
| PointNet | 89.2% |
| Voxel 3D CNN | 77.0% |
- The pretrained-backbone economics from the problem formulations - millions of labeled images transfer, native 3D starts from nothing
Meshes, in brief
- Convolution on the vertex graph - spectral (Laplacian eigenbasis) or spatial (learned neighbor weights)
- Standard in graphics and shape analysis, rarer in perception pipelines
Monocular Depth Is Dense Regression
One depth per pixel: \(D \in \mathbb{R}^{H \times W}\) - a dense map again, with a regression target.
Scale-invariant loss - with \(d_i = \log \hat{D}_i - \log D_i\):
\[\mathcal{L}_{si} = \frac{1}{n}\sum_i d_i^2 - \frac{\lambda}{n^2}\Big(\sum_i d_i\Big)^2\]
- A single view fixes depth only up to scale - the ambiguity from pose estimation
- The second term forgives a global scale error
Ordinal loss - over pairs \((i, j)\) with known order:
\[\mathcal{L}_{ord} = \sum_{(i,j)} -\log \sigma(z_i - z_j)\]
- “Closer than” is cheap to annotate - relative labels replace metric ones
Photometric loss - no labels at all:
\[\mathcal{L}_{photo} = \|I_{t+1} - \text{warp}(I_t, D_t, T)\|_1 + \text{SSIM terms}\]
- Predicted depth and camera motion reconstruct the next video frame - reconstruction error supervises both
- Structural similarity (SSIM) compares patches, tolerating lighting change
Video supplies unlimited training pairs with no depth labels - the annotation constraint from the problem formulations does not bind here.